
Year-End 2021
Atlanta Housing Market Analysis

Atlanta Housing Market Analysis
Despite ongoing challenges concerning affordability, supply, inflation, and COVID-19 variants, 2021 was a very positive year in terms of economic recovery for the Atlanta MSA. The Atlanta region added nearly +135,000 jobs in 2021, bringing the unemployment rate down to just 2.8% (considered full employment) by the end of December. The largest job gains in recent months have come from the sectors hit hardest by the initial onset of the pandemic last year – Leisure & Hospitality, Trade & Transportation, and Business & Professional Services. The MSA got an additional boost during 2021 with Visa and Microsoft announcing major expansions of their Atlanta-based workforces that will ultimately bring thousands more high-paying professional services and tech jobs to the region.
Bolstered by improving economic conditions and sustained demand from potential homebuyers, Atlanta’s housing market improved in line with the larger economy, posting notable gains in major metrics like housing starts, new home closings, and lot deliveries. In 2021, Atlanta’s housing market was driven by the following factors:
Accelerating Price Growth: As seen in most major Metros across the U.S., both new and existing home prices increased significantly in 2021. The average home sale price hit $447,000 in December, a +19.2% increase over the average price in December 2020. Rapid home price growth is being fueled by a number of factors including low housing inventory (-22.3% YoY), strong demand, and increasing land and construction costs.
Low Inventory & Supply: Atlanta is combatting a shortage of both developed lots and available homes, and this critical lack of inventory is helping to drive the accelerated price growth noted above. Low finished lot inventory has resulted in fewer new home deliveries and higher prices for land suitable for residential development, which builders have attempted to combat by shifting their focus to suburbs farther from the urban core. Depleted inventories of new and resale homes, along with increasing construction costs passed from the builder to the buyer, has contributed to skyrocketing home prices across the Metro area.
Expanding Suburbs: Atlanta has been famous for its sprawl since the 1960’s, and it shows no signs of slowing anytime soon. The lack of finished lots and land suitable for development closer to the urban core, combined with people’s newfound ability to work from home and avoid commuting entirely, has opened up outer suburbs that were always considered too far from the city center to be viable for large-scale residential development. For context, 8 of Atlanta’s top 10 performing communities in 2021 are located more than 30 miles from downtown.
Sources: U.S. Bureau of Labor Statistics, Business Insider, Trulia, Zonda/Metrostudy, Federal Reserve Bank
Mortgage Rates

Source: Federal Reserve Bank of St. Louis

Source: Federal Reserve Bank of St. Louis
Mortgage rates increased steadily throughout 2021 after reaching all-time low levels in 2020. 30-year mortgage rates closed out the year at 3.11%, an increase of +16.5% over the last 12 months. A rate of 3.11% is still well below the 20-year average (4.74%), but rates are expected to increase further in 2022 based on statements from the Federal Reserve indicating multiple rate hikes in the year ahead to combat growing concerns around inflation. This could result in an uptick in home-buying activity in the early part of 2022 as potential buyers look to lock in low rates before it’s too late.
Active Listings
Active Listings: Total

Source: Atlanta Association of Realtors
Active Listings: Months’ Supply

Source: Atlanta Association of Realtors
The number of active listings (homes available for purchase) in Metro Atlanta saw a much-needed bump in the late summer/early fall months before dropping steeply in Q4, ending the year with -15.8% fewer active listings as compared to January 2021. The critically low inventory level combined with sustained demand from potential buyers has driven the supply of active listings down to just 1.0 month, the lowest level ever recorded in the Atlanta market.
Housing Starts
Housing Starts: Total

Source: Metrostudy
12 months, eclipsing the 30,000 mark for just the second time since 2007. Single-family detached (SFD) starts grew by nearly +21% over the last 12 months as builders ramped up production to meet the seemingly infinite demand for new homes. Single-family attached (SFA) starts have exploded in recent months, increasing by +45% since the end of 3Q20. SFA product has become more popular for builders in this current environment of increased costs and extended construction times, allowing them to maximize project density and preserve their bottom line.
Housing Starts: By Price Range

Source: Metrostudy
Increasing land and construction costs continue to drive new home price growth in the Atlanta market. As shown above, there has been a considerable shift to the higher price tiers over the last 4 years. In 2018, only 45.7% of new homes started fell into the $300K+ price tiers; by the end of 2021, however, this figure had climbed to 71.2%. Over the last 4 years, there has been an +85.1% increase in the number of new homes started at or above the $300K level and a -36.9% decrease in the number of new homes started below the $300K level.
New Home Closings
New Home Closings: Total

Source: Metrostudy
Sustained supply chain, skilled labor, and inventory issues slowed the acceleration of new home closings in 2021 to +7.0% in 2021, compared to +12.5% growth during 2020; the 29,170 new home closings over the last 12 months represent the highest annual total since 2007. SFD and SFA closings increased by +3.7% and +19.2%, respectively, over the last 12 months – further evidence of the rising popularity of attached housing due to land and pricing constraints in the Atlanta market.
Lot Deliveries
New Home Closings: By Price Range

Source: Metrostudy
New home closings’ gradual shift to the upper price tiers has been accelerated over the last 12-24 months due to increasing land and construction costs. New home closings below the $300K price tier declined by -26.7% during 2021 as compared to 2020. The shift away from new homes below the $300K level is concerning for the Atlanta market given that median income growth has not kept pace with home price growth, meaning that an increasing number of potential buyers are being priced out of the market.
Lot Deliveries: Total

Source: Metrostudy
Lot development ramped up significantly in 2021 with overall lot production increasing by +36.1% (+42.7% increase in SFD and +20.3% increase in SFA lot deliveries). While more than 16,000 new lots were delivered in the Atlanta market in 2021 (highest level since 2007), it’s important to remember that most of these lots were spoken for by builders prior to being developed, so in reality these lot deliveries did very little to improve the inventory and supply levels.
Lots in Development

Source: Metrostudy
Most of Atlanta’s future lots fall into the Dormant category, meaning that there has been no development or new construction activity in the last 24 months. It is estimated that as many as one-third of these lots will never come on-line. There are currently more than 35,000 lots in active development which are expected to deliver in the next 6-18 months.
Inventory & Supply
Inventory & Supply: SFD

Source: Metrostudy
SFD lot inventory and supply levels declined steadily throughout 2021. Extended development times and strong demand drained the SFD lot inventory to just over 40,500 lots – the lowest level since Metrostudy began tracking this metric in 2000. Metro Atlanta’s supply of SFD lots declined by -19.4% during 2021 to just 21.6 months, the lowest level since 2005. Despite the increase in lot development, we expect inventory and supply metrics to remain below “healthy” levels until the margin between demand and deliveries is more balanced.
Inventory & Supply: SFA

Source: Metrostudy
As with SFD lots, SFA lot inventory and supply declined significantly during 2021, decreasing by -16.7% and -32.8%, respectively. Despite the +20.3% uptick in SFA lot deliveries, inventory still dropped to its lowest level since 2004. Surging demand for attached product has driven Metro Atlanta’s SFA lot supply down to just 13.7 months, a low not seen since 2002. Given that SFA closings outpaced SFA lot deliveries by more than 20%, we expect SFA lot inventory and supply to remain near record-low levels..
Market Leaders
Starts Leaders

Source: Metrostudy
Gwinnett County continues to lead the Metro Atlanta area in housing starts, followed by Cherokee, Forsyth, Henry, and Dekalb counties. Growth in counties like Cherokee, Forsyth, and Henry, which have historically been considered secondary submarkets, has accelerated in the last 18-24 months and is being driven by a number of factors including the availability (and therefore lower price) of residential land and the emergence of the Work from Home movement, which is allowing people to live in areas farther from traditional employment centers.
Closings Leaders

Source: Metrostudy
The closing leader list closely resembles the starts leader list, with Gwinnett County leading the pack at 3,627 annual new home closings, a +26.3% increase over 2020 closings. Cherokee, Forsyth, Dekalb, and South Fulton counties round out the top 5, combining for an additional +7,300 new home closings during 2021. Other counties that had significant increases in new home closings over the last 12 months include Hall (+20.9%), Bartow (+40.7%), Jackson (+20.2%), Newton (+21.9%), Spalding (+70.7) and Walton (+20.7%).
Lot Delivery Leaders

Source: Metrostudy
Lot deliveries increased significantly in 2021 with 16 of Metro Atlanta’s 23 counties posting double digit percentage increases over the last 12 months (3 of those 16 were triple digit increases). Gwinnett County led the Metro area in lot deliveries with 4,527, a +47.8% increase over lot deliveries in 2020. Cherokee (+10.7%), Henry (+93.6%), Hall (+95.6%), and Cobb (+33.0%) counties rounded out the top five performers, delivering a combined 6,442 lots during 2021. We expect lot deliveries to increase across the Metro area in 2022, especially in those once-secondary submarkets where land suitable for residential development is more readily available.

Most Active Communities

Source: Metrostudy
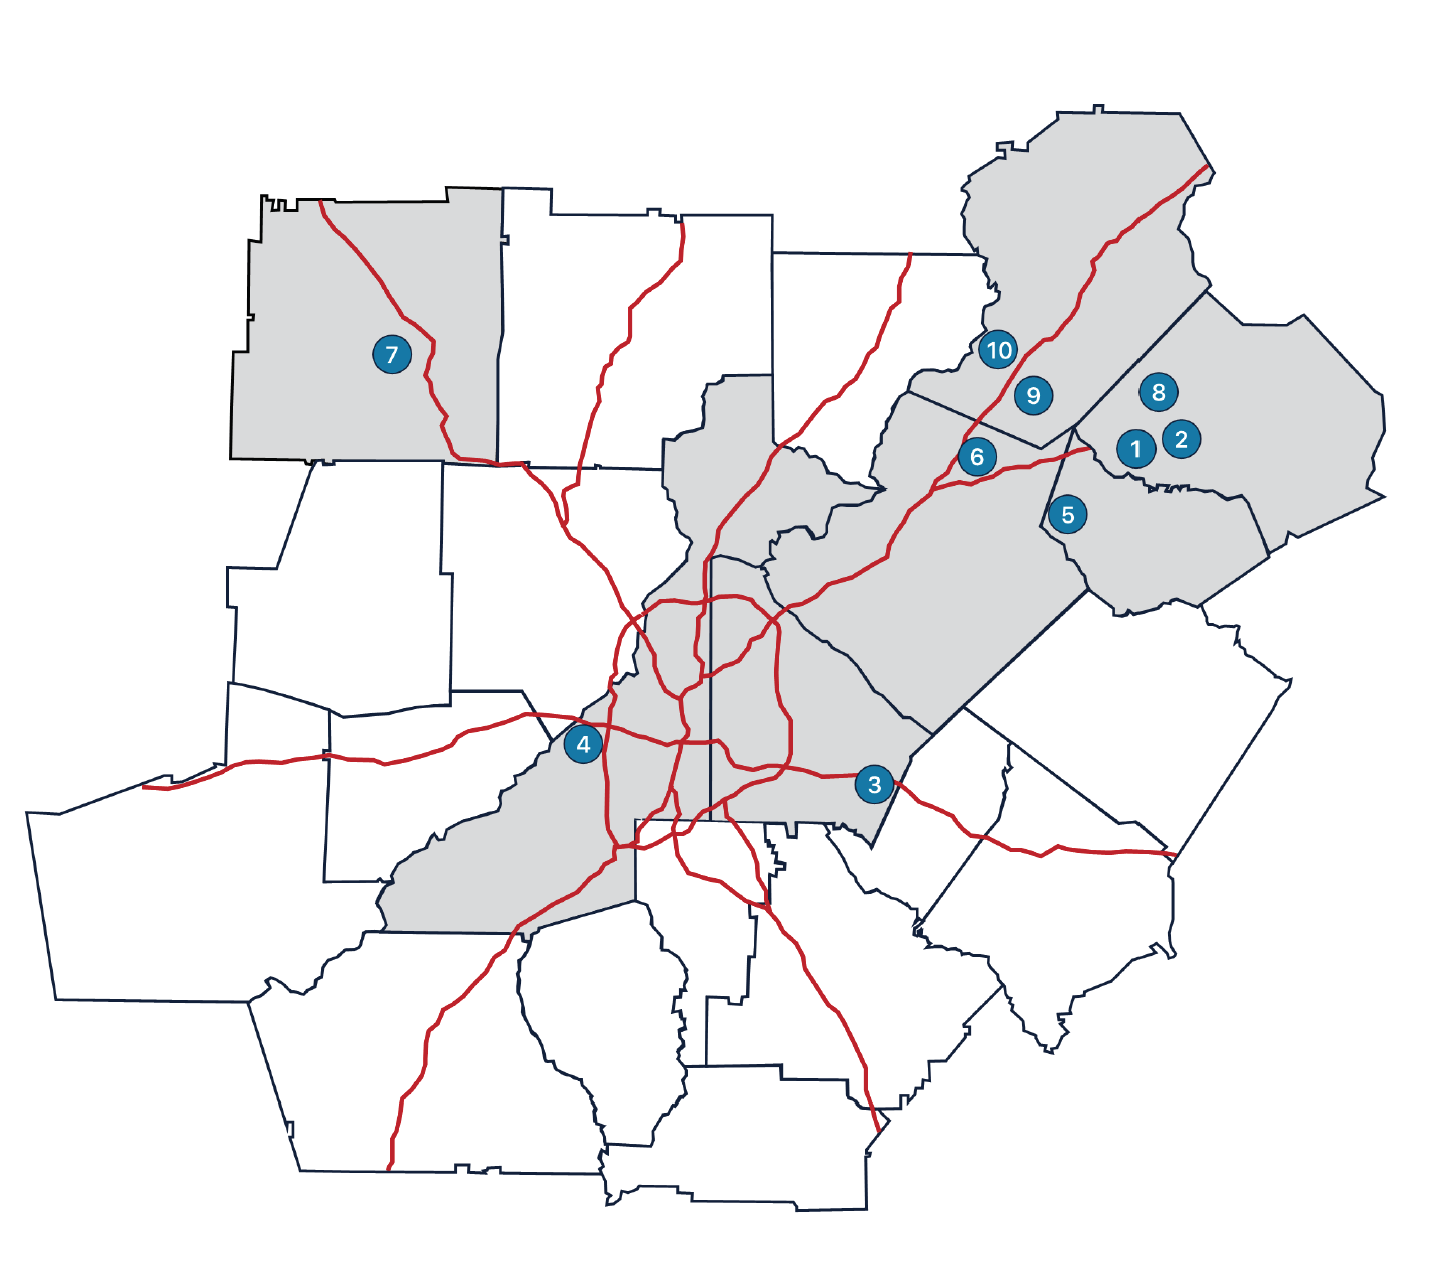
The map to the right provides a visual summary of the top-performing communities in Metro Atlanta over the last 12 months. After diving deeper into these communities, here are a few key takeaways:
7 of the top 10 communities offer strictly attached housing or a mixed of attached and detached product.
7 of the top 10 communities have less than a 1-year supply of finished lots remaining, and 5 of the top 10 communities have less than a 6-month supply. Based on recent absoprtion figures, all 10 of these communities will be sold out within 18-24 months.
7 of the top 10 communities are in secondary submarkets once considered too far from Atlanta’s urban core to be viable for large-scale residential development.
Leading Builders

As has been the case since coming out of the Great Recession, D.R. Horton led all production homebuilders in the Metro Atlanta market with 3,375 total new home closings in 2021. Lennar, Century Communities, Rocklyn Homes, and Chafin Communities rounded out the top 5 builders, combining for a total of 4,413 new home closings in 2021. 7 of the top 10 builders posted increases in annual closings with Rocklyn Homes (+85.4%), Liberty Communities (+108.1%), Rockhaven Homes (+73.1%), and Pulte (+45.6%) achieving the largest YoY gains. The uptick in closings from builders across Metro Atlanta illustrates the market’s strong demand for housing and is especially impressive when you consider the supply chain, labor, and inventory headwinds builders faced for the entirety of 2021.
Conclusion
Improving economic conditions and strong demand fueled Atlanta’s housing market in 2021 and drove starts, closings, home prices, and lot deliveries to record-high levels. While we expect that housing metrics will continue their upward trajectories in 2022, we anticipate that the rate of growth will return to more sustainable levels.
Despite our expectations of the continued improvement of Atlanta’s major housing metrics, the market is facing some significant headwinds that could have negative or stagnating effects on the market in 2022. We’ve detailed the factors that we believe will drive Atlanta’s housing market over the next 12 months:
Affordability Challenges: When you compare YoY home price growth (+19%) and inflation (+7%) to wage growth (+3%), it’s easy to see why rapidly increasing home prices are becoming a greater concern for the Atlanta market. Consider this – with a household income of $71,740 (the median income for the Atlanta MSA), the upper range for realistic home pricing is $274,000 - $295,000. When you consider that the median new and existing home prices in 2021 were $382,000 and $324,000, respectively, it is obvious how many of Atlanta’s potential homebuyers are being priced out of the market. Because there are no short-term solutions in place or around the corner for the issues that are driving this accelerated price growth, namely low supply and high construction costs, affordability will become an even greater concern in 2022.
Sustained Demand: While the pandemic certainly had a significant positive impact on demand for housing, the persistence of this demand 18+ months following the pandemic’s initial onset is evidence that the pandemic conditions did not create demand, rather unleashed it. We expect demand in the Atlanta market to remain strong throughout 2022 based on demographic and migration factors alone; there are currently 900,000+ Millennials within the Atlanta MSA that are either in or approaching “prime homebuying age” (31-34 years), and Atlanta continues to be a top in-migration market from higher priced areas of the country like New York City, Chicago, Los Angeles, and Miami. The above factors will ensure that demand for housing in the Atlanta market remains strong for the foreseeable future.
Low Supply: As mentioned in the opening of this report, both lot supply and home supply are concerns for the Atlanta market due to the implications of low supply on starts, sales, and prices. The low supply of finished lots has driven land costs up, and those costs are passed along from the builder to the end buyer through increases in the base cost of new homes. The low supply of homes available for sale, both new and resale, has created a hyper-competitive buying environment that is seeing 30% of homes sell for over asking price. The fact of the matter is that Atlanta has been under-developing lots and under-delivering new housing product since coming out of the Great Recession, and the increase in lot development and home construction we saw in 2021 will not be sufficient to move the supply needle. With this in mind, we expect inventory and supply levels to improve slightly in 2022 but remain near record-low levels.
For information about market research & reporting, including custom market reports, please contact Katie Fidler at katief@stbourke.com.
