National: 3Q2021
Housing Market Analysis
National Housing Market Analysis
The U.S. economic recovery continued in 3Q21, although overall growth was not as robust as some had initially projected.
GDP growth slowed to an annual rate of just +2.0% during the third quarter, down from +6.7% in 1Q21 and +6.3% in 2Q21. This slowdown in growth can be attributed to a number of factors including the proliferation of the COVID Delta variant, continued supply chain issues across various sectors of the economy, inconsistent consumer spending, and a drop in residential investment (including new home construction and renovations). Annual GDP growth for 2021 is now projected at +5%, which would make it the highest annual growth for the U.S. since 1984.
The economy added 1.16 million jobs during 3Q21, bringing the year-to-date total to over 4.1 million jobs. While the current unemployment rate stands at 4.6%, it’s important to consider that the labor force shrunk considerably following the onset of the pandemic (-3.1 million workers), so the current unemployment rate is not necessarily representative of the actual employment situation. When factors like underemployment and labor force losses are considered, the employment rate is closer to 8.3%.
“The lack of material availability is making it take longer to build a home, and the delays and higher input costs are contributing to rising home prices.”
Ali Wolf - Chief Economist, Zonda
From a housing perspective, the market is showing initial signs of cooling off from last year’s frenzy: starts and closings have remained well below peak levels established in the second half of 2020, builder confidence has dipped closer to the long-term average, and new home supply has increased in five of the last six months. This reduction in activity is pushing the housing market back towards more normal levels, which should ultimately work to soften the extreme price growth and improve the depleted housing inventory we’ve experience over the last 12-18 months.
Notable takeaways from activity in 3Q21:
Normalizing Housing Market: After several quarters of unprecedented home construction and sales activity, 3Q21 metrics indicate that the national housing market is backing down from the peak levels established last year. Demand is beginning to cool given rising mortgage rates and home price increases, and we are starting to see positive movement in housing inventory levels.
High Home Prices: Low inventory, increasing land prices, and high construction costs continue to put upward pressure on new home pricing in markets across the country. With new and existing home prices up nearly +20% and +14% year-over-year, respectively, concern around housing affordability is gaining steam – fast.
Persistent Supply Chain Issues: The supply chain issues experienced in various sectors of the economy since the onset of the pandemic have unfortunately persisted, and in some cases worsened, thus far in 2021. The scarcity of essential home construction materials like lumber and copper has not only elongated construction times by 3-6 months, but has also contributed to rapid home prices growth as builders pass these costs through to the homebuyer in an effort to preserve their margins.
Low Lot Inventory: Low lot inventory was an issue in the U.S. long before the pandemic, but the increased emphasis on housing since the initial lockdowns has put the low inventory levels in the national spotlight. In fact, some have said that the biggest supply chain shortage homebuilders are facing right now is developable land. More than 75% of builders are currently describing lot supply in their active markets as “low” or “very low.”
The data provided in the following report has been interpreted and analyzed through the lens of residential development and home construction. Understanding key market metrics and their implications is essential to making informed decisions and remaining flexible as a business, especially during these unprecedented times.
Mortgage Rates
Source: Mortgage Bankers Association
Source: Mortgage Bankers Association
While 30-year mortgage rates are still well below the historical average, they crept up steadily over the last 3 months and ended 3Q21 just above 3.0%. In September, members of the Federal Reserve Bank suggested that they will soon taper off purchases of mortgage-backed loans and could potentially raise rates in 2022, which would likely push interest rates back towards pre-pandemic levels. Increasing rates will only further worsen the country’s growing housing affordability crisis and act as a barrier for more potential buyers when obtaining mortgage loans.
Builder Confidence
Source: National Association of Homebuilders, Wells Fargo
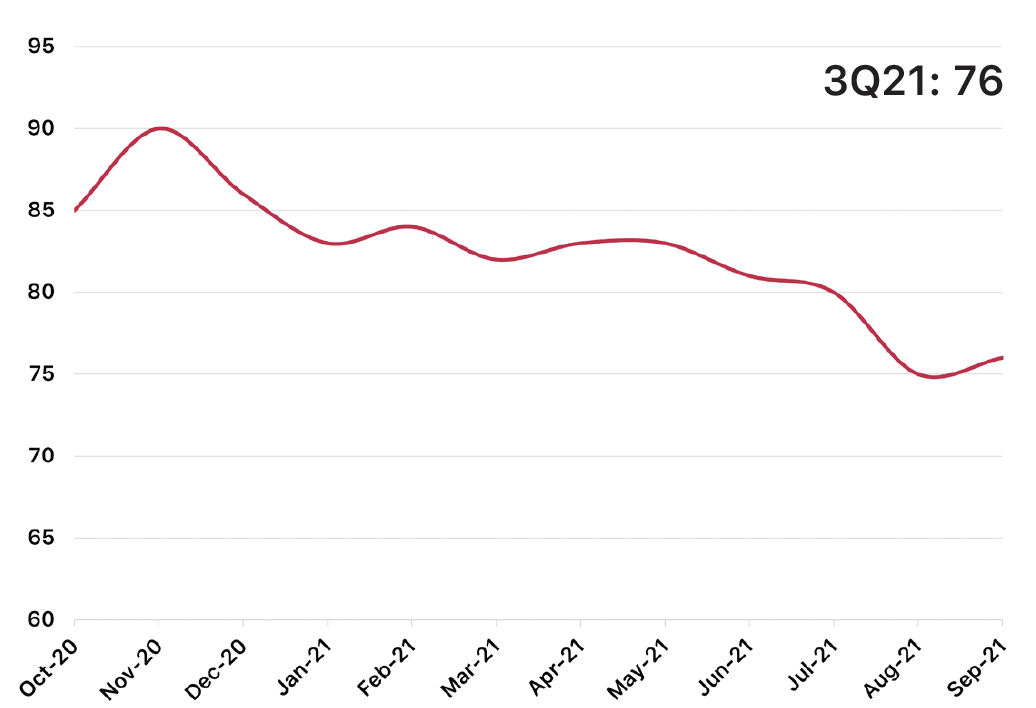
Builder Confidence remains below the peak established late last year due namely to persistent supply chain and construction labor issues, which are contributing to extended delivery times in nearly every market. Additionally, builders are also contending with growing concerns around affordability based on the unprecedented growth of both new and existing home prices over the last 12-18 months (detailed further on the following page). Given that there is no simple solution to the supply chain, labor, and affordability issues that builders are combatting, we expect Builder Confidence to remain in the high-70’s to low-80’s range through the end of 2021.
Single-Family Housing Starts
Source: U.S. Census Bureau
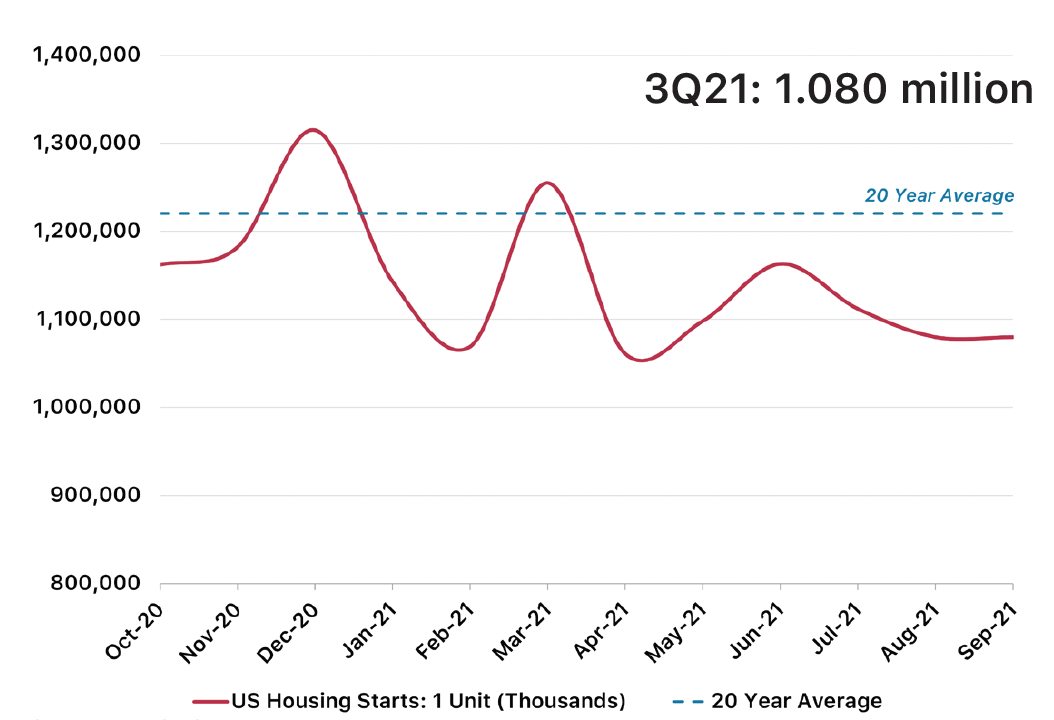
Single-family housing starts declined through 3Q21 and are currently -7% below where they were a year ago. Context here is critical, however; starts have not declined due to a lack of demand, rather builders are being forced to intentionally limit their starts due to persistent supply chain issues, high materials costs, and extensive pre-order backlogs that remain from the buying frenzy that followed last year’s strict lockdowns. We expect starts to remain intentionally stifled until building supplies are more consistently available, but even then builders will be combatting what is being called “the worst lot shortage in history,” which has the potential to limit starts further.
New Single-Family Home Sales
Single-Family Home Completions
Source: U.S. Census Bureau
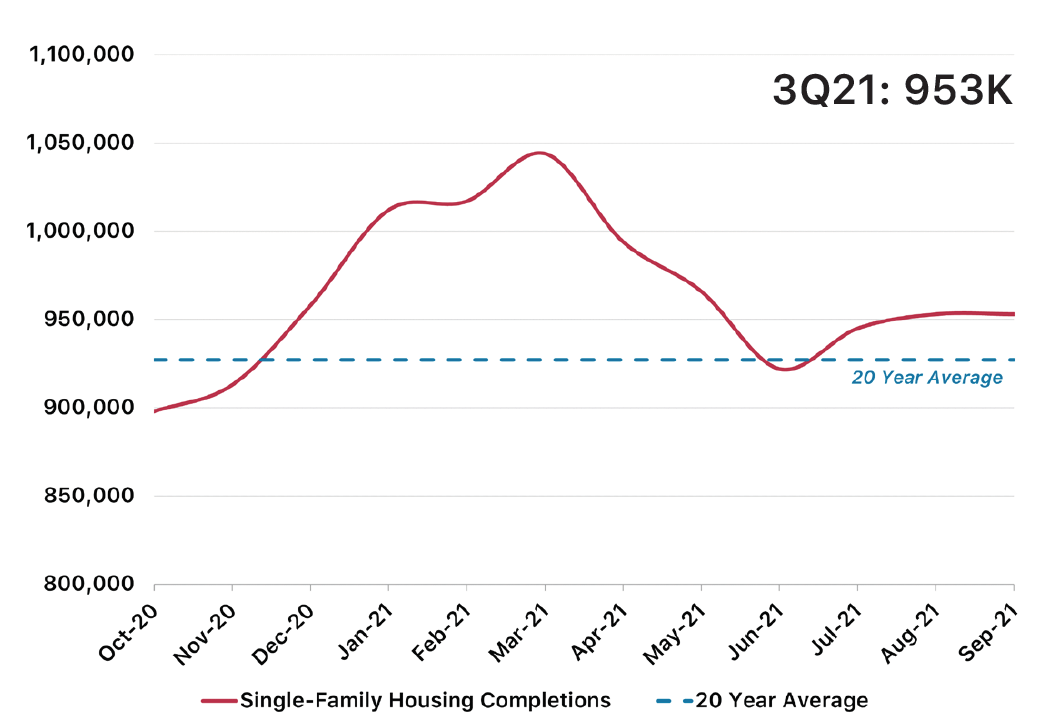
New home completions rebounded above the 20-year average in 3Q21 after declining steadily since the beginning on the year. When builders restrict their starts, they are effectively restricting their completions as well. Through the end of the year, we expect completions to remain closer to the long-term average than they were heading into the Spring months given suppressed starts levels and extended construction timeframes.
Source: U.S. Census Bureau
New home sales reached a six-month high at the end of September, increasing by +17% during 3Q21. While new home sales are down more than -17% from levels seen 12 months ago, it’s important to remember that the level of activity seen in the second half of 2020 was significantly above “normal” levels and is not necessarily an appropriate measuring stick for current activity. We expect sales activity to remain above long-term average levels based on the continued demand for housing combined with a continued shortage of new and spec housing inventory.
Median Sale Price: Existing Homes
Median Sale Price: New Homes
Source: U.S. Census Bureau, National Association of Homebuilders
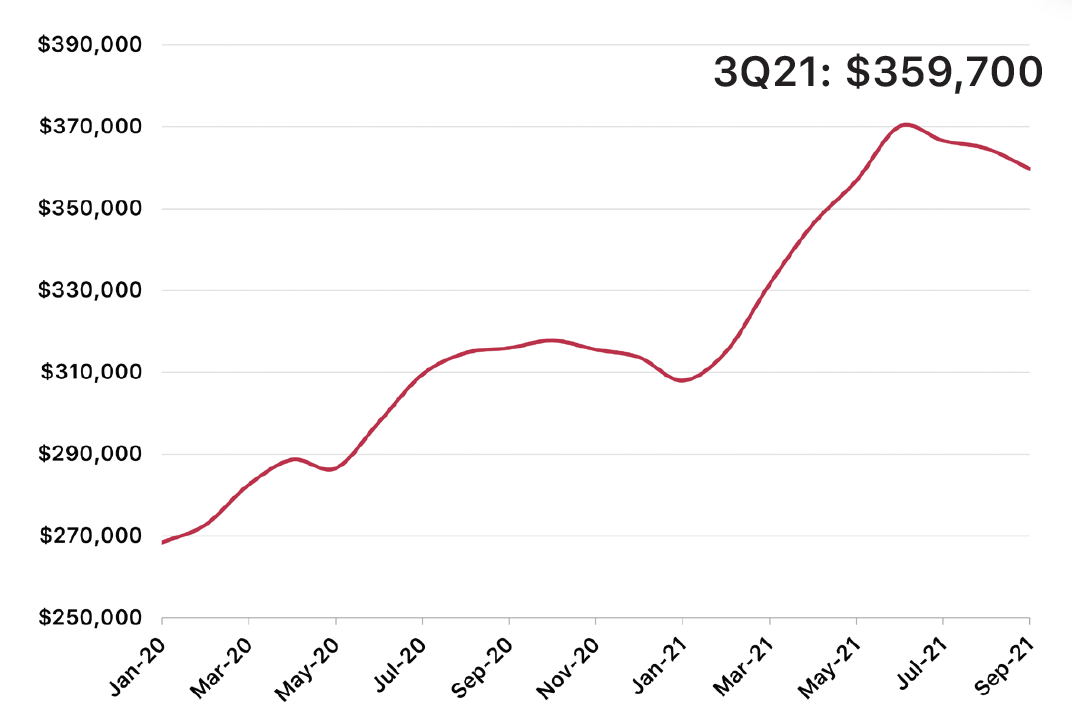
In 3Q21, new home prices continued to increase at an unprecedented rate, growing by +9% since 2Q21 and +19% over the last 12 months. Increased construction costs, high land prices, and extremely limited finished home inventory are the driving factors behind this extreme price growth, and we expect new home prices to continue to climb through the end of the year and into 2022, although perhaps not at such an accelerated rate.
Source: National Association of Realtors
Unlike new home prices, existing home prices actually decreased slightly during 3Q21. Despite this recent dip, 3Q21 existing home prices were still +17% higher than levels seen 12 months prior. Demand is still strong, although increasing mortgage rates and skyrocketing prices have worked to reduce the number of active buyers in the market over the last several months.
Housing Affordability
Home Price Index
Source: Standard & Poor’s
The Case-Shiller Home Price Index reflects what we saw on the previous page regarding new home pricing - low supply, strong demand, and increased builder costs have driven home prices upward at an alarming rate. The Home Price Index has increased by +13% thus far in 2021, compared to 10% growth during the entirety of 2020. Based on strong demand and low supply levels, we expect the Home Price Index to continue its upward trajectory through the end of the year.
Source: National Association of Realtors
Housing affordability remained relatively steady through 3Q21 after dropping steeply in the first half of the year. Skyrocketing home prices, discussed on the previous page and to the left, combined with increasing mortgage interest rates have driven driven the housing affordability index down to levels not seen since 2008. We expect affordability levels to rebound slightly from current levels, however affordability will remain a concern so long as home price growth continues to accelerate.
New Home Supply (Months)
Source: U.S. Census Bureau
New home supply dipped slightly in September following five straight months of increases and currently stands at 5.7 months - well below what is considered a “normal” market. Supply remains low due to several factors, namely persistent demand from homebuyers, extended home construction times, and extensive builder backlogs. Because there is no definitive solution in sight for the above challenges, we expect supply to remain well below “normal” levels through the end of this year and into 2022.
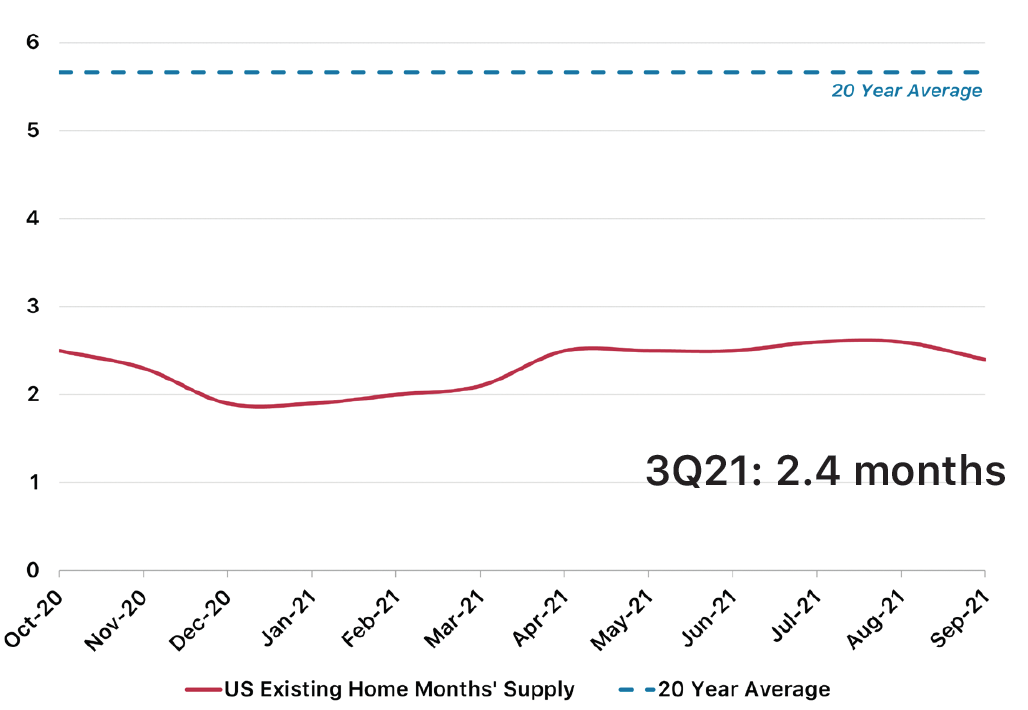
Existing Home Supply (Months)
Source: National Association of Realtors
Existing home supply has been relatively steady over the last year and currently stands at just 2.4 months (normal market = 5 months). Lingering seller concerns around the transmission of COVID, refinancing opportunities for potential sellers, and the surge of institutional homebuyers into the market have all contributed to keeping existing home inventory near all-time low levels. We anticipate that this trend will continue through the end of 2021, but start to return to more normal levels during 2022.
Conclusion
Third quarter metrics revealed both strong and weak points in the U.S.’s economic recovery to-date:
We continue to add hundreds of thousands of jobs back to the economy each month, but the number of jobs added in recent months have fallen far short of projections.
The overall economy (GDP) grew in 3Q21, but only by 2% (annualized) – well below the 6.7% and 6.3% GDP growth posted in the first and second quarters, respectively.
The 1.6% increase in consumer spending in 3Q21 set a new record-high, but the sub-2% growth pales in comparison to the 12% growth we saw in 2Q21.
While the third quarter of 2021 produced some mixed messages in terms of where the economy is in its overall recovery, the housing market undoubtedly remains a bright spot. Both new and existing home sales are well above their long-term averages, and we expect that trend to continue based on strong demand brought on by a combination of demographic headwinds, lifestyles changes, and low interest rates.
“The backlog of starts - which reflects numerous supply-side constraints, including high input costs and difficulty attracting skilled workers - should underpin housing construction in the months ahead.”
Nancy Vanden - Lead U.S. Economist, Oxford Economics (New York)
There are several factors that we believe will have a significant impact on the housing market through the end of the year:
Rising interest rates – Interest rates creeped back above 3% during 3Q21, and recent messaging from the Federal Reserve Bank indicates that rates will continue to climb through the end of the year and into next. This steady increase in rates is adding hundreds of dollars to potential homebuyers’ monthly mortgage payments and contributing to the growing affordability crisis facing this country.
Growing affordability concerns – High land and materials costs, extended construction timelines, and critically low inventory are all pushing home prices up at an accelerated rate. Currently, the average household is spending 33% of their income on housing costs (30% or less is considered “affordable” per the Department of Housing and Urban Development), and this trend will continue so long as home prices growth continues to outpace wage and income growth by such a significant margin.
Combatting supply issues – At the end of 3Q21, the Lot Supply Index (Zonda) was down -37% YoY, and every major market in the U.S. is now classified as “significantly undersupplied.” The continually shrinking Lot Supply Index indicates that builders are buying finished lots faster than they can be replaced, and most developers are reporting that new lots are spoken for before horizontal development even concludes. Developers and builders have significantly increased lot production over the last 12 months (there are currently +14% more lots in development than there was at the end of 3Q20), but supply chain bottlenecks and labor shortages are resulting in extended development times for these lots.
“These supply chain issues will absolutely continue into 2022, but may begin to ease as we head into 2023. The idea that we are going to see a reset where prices go down back to 2019 levels is unlikely. But the run-up in pricing is going to slow.”
Robert Dietz - Chief Economist, National Association of Home Builders
For information about market research & reporting, including custom market reports, please contact Katie Fidler at katief@stbourke.com.


