Atlanta: 1Q2022
Housing Market Analysis
Atlanta Housing Market Analysis
Atlanta’s strong recovery continued in 2Q21 despite growing concerns around affordability and the oncoming threat of the COVID-19 Delta variant. To-date, the Metro area has recaptured 78% of the jobs lost due to initial COVID-19 shutdowns and layoffs, and Atlanta currently boasts one of the country’s lowest Metro unemployment rates at just 3.6%. Atlanta’s housing market remains one of the brightest spots in the recovery as it continues to build on the momentum established in the second half of 2020 and the start of 2021.
The Atlanta housing market is currently being driven by the following factors:
Affordability: Home prices in Atlanta have skyrocketed since mid-2020 when demand soared and inventory vanished. Atlanta’s median home sale price at the end of Q1 was +25.4% higher than it was 12 months ago (compared to +15.7% price growth nationally over that same period). This uptick feels even more severe when you consider that annual wage growth for this same period was just +3.5%. High inflation (+8.5%) and increasing mortgage rates, which jumped by +48.4% to 4.6% by the end of Q1, are beginning to work against affordability as well.
Low Inventory: As has been characteristic of this market for the last 2+ years, the Atlanta market continues to face extremely low inventories of both available homes (new + existing) and finished lots suitable for home construction. Drivers like the WFM movement and shifting demographics are keeping demand near historic levels, but a lack of homesites and finished homes is creating intense bidding wars between builders and homebuyers alike.
Growing Exurbs: Land availability and pricing challenges continue to push residential development farther from Atlanta’s urban core. In Q1, 9 of the area’s top 10 performing communities were located 30+ miles from downtown in areas of the region that were once considered too far from the city center to be viable for large-scale residential development.
Sources: U.S. Bureau of Labor Statistics, Bloomberg, BizNow, Atlanta Business Chronicle, Zonda/Metrostudy, Federal Reserve Bank, Atlanta Journal-Constitution
Mortgage Rates
Source: Mortgage Bankers Association
Source: Mortgage Bankers Association
The Federal Reserve Bank increased interest rates by 25 basis points in mid-March, marking the first rate increase since 2018. 30-year mortgage rates, which started the year just above 3.1%, increased steadily though January and February before jumping above 4.0% almost immediately following the rate hike announcement from the Fed. 30-year mortgage rates had eclipsed 4.6% by the end of Q1 and are expected to increase further as the Federal Reserve plans five additional rate hikes (two more 25-basis point hikes and three 50-basis point hikes) before the end of the year.
Active Listings
Active Listings: Total
Source: Atlanta Association of Realtors
Active Listings: Month’s Supply
Source: Atlanta Association of Realtors
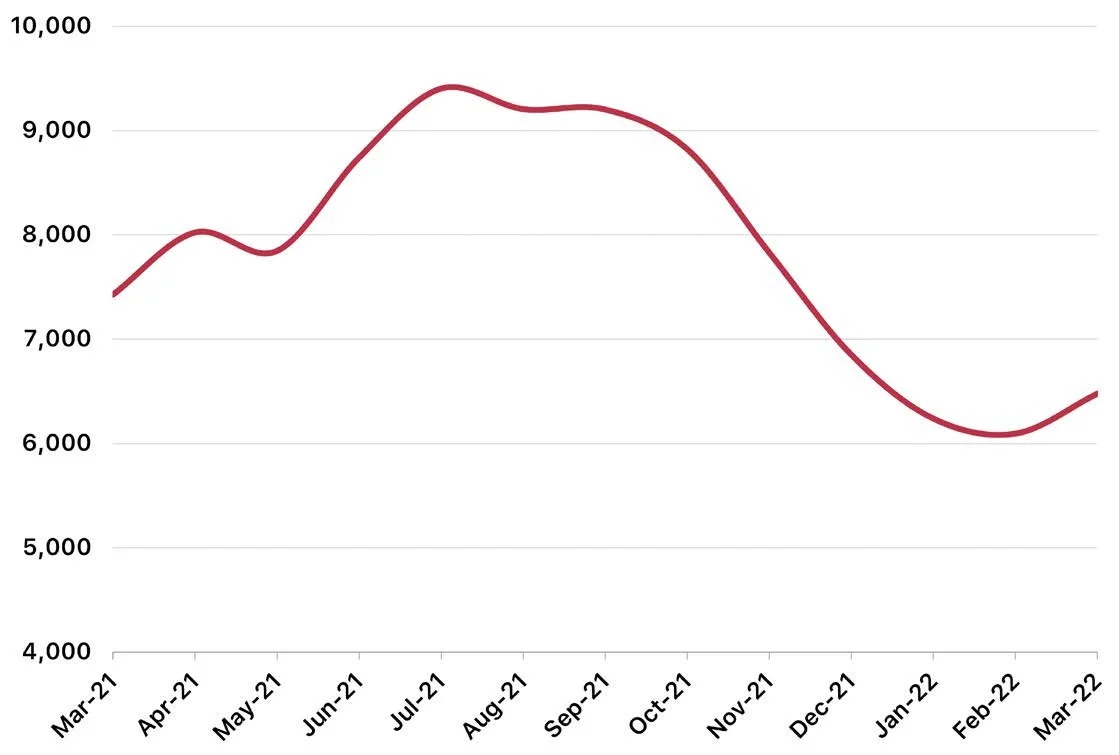
Following a steady decline through the 2nd half of 2021, the number of active listings (new & existing homes available to purchase), continued along this trajectory in January and February before rebounding modestly in March. Despite the late improvement, active listings declined by -5.5% from the end of December and have decreased by -12.8% over the last 12 months. The months’ supply remains unchanged from Q4 levels (1 month) due to an off-setting decline in sales.
Housing Starts
Housing Starts: Total
Source: Metrostudy
Ongoing material availability, labor shortage, and lot inventory issues resulted in modest declines for both total and single-family detached (SFD) housing starts in Q1. Total starts decreased -3.1% from the end of December but remain relatively unchanged from their position 12 months ago (-1.5% decline); SFD housing starts are down -4.2% and -4.7% over those same time periods. While SFA starts declined slightly from the end of Q4 (-.7%), they’re up +14.2% from the end of Q1 2021. SFA starts will continue to comprise a growing share of total starts moving foward as SFA units often offer a lower-cost path to homeownership as compared to traditional SFD homes.
Housing Starts: By Price Range
Source: Metrostudy
The Atlanta market was officially deemed “unaffordable” by the Federal Reserve Bank after analyzing home prices against median household income. Home price growth continues to accelerate across the Atlanta market due to extremely low inventory, (intentionally) limited housing starts, and extended construction times. The $300K-$399K segment continues to be the dominant price range for new homes in the Atlanta market, however we are seeing the higher price tiers ($400K+) account for a growing share of starts. 12 months ago, homes above $400K comprised 22.6% of the market; in Q1, homes above $400K comprised 40.6% of the market.
New Home Closings
New Homes Closings: Total
Source: Metrostudy
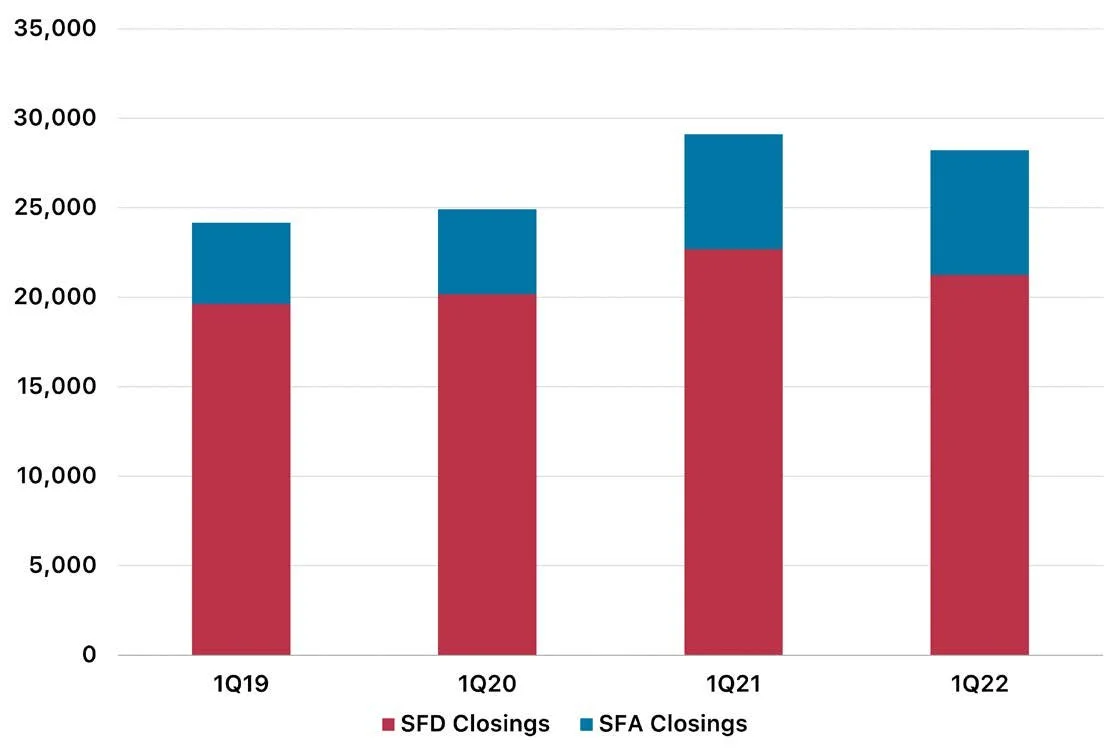
Both total and SFD new home closings declined during Q1, likely due in part to the seasonal slowdown in new home construction during the winter months due to holidays and inclement weather. Total closings declined by -3.3% from the end of December and have fallen -3.1% over the last 12 months, and SFD closings decreased by -4.4% and -6.4% over those same time periods. SFA closings, however, went the opposite direction in Q1; SFA closings increased slightly from the end of December (+.2%) but are up +8.5% compared to Q1 2021.
Lot Deliveries
New Homes Closings: By Price Range
Source: Metrostudy
The $300K-$399K segment was the dominant price range for new home closings in Q1, comprising 35.4% of all new home sales. As with starts, closings have shifted to the higher price tiers over the last year, and the market share of homes above $400K increased from 53.3% to 72.0% over the last 12 months. Price growth might ease as the year progresses but is expected to remain well above long-term average levels due to significant increases in home construction costs and an extremely low inventory of homes that buyers are competing for.
Lot Deliveries: Total
Source: Metrostudy
While both total and SFD lot deliveries declined slightly during Q1 as compared to the end of December, both metrics have made significant gains over the last 12 months, increasing by +19.1% and +23.6% respectively. Given the increase in demand for attached housing, SFA lot development has received a strong boost. Despite a model Q1 gain (+0.2%), SFA lot deliveries have increased by +8.4% over the last 12 month period.
Lots in Development
Source: Metrostudy
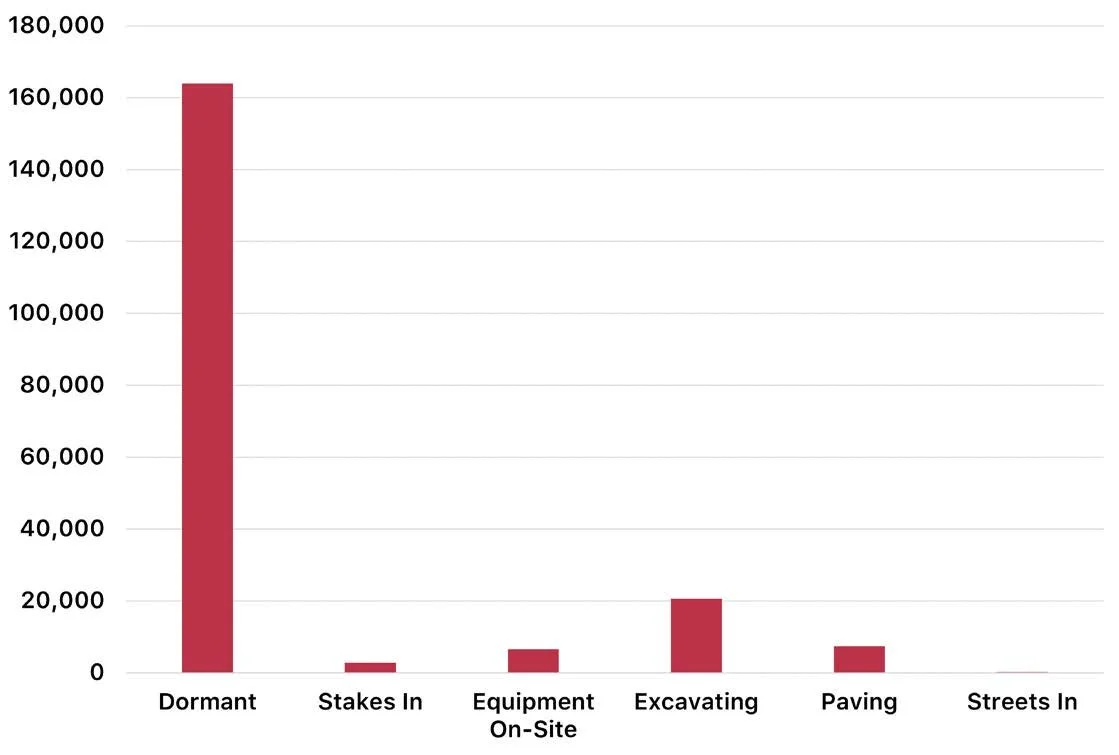
While most (81.3%) of Atlanta’s future lots remain in a dormant state, we are beginning to see evidence of meaningful movement in the region’s lot development pipeline with more than 2,500 lots transitioning from “dormant” to “active development” in Q1. Since the end of December, the share of lots in “stakes in” stage declined from 13% to 7%, and the share of lots in the Excavating stage grew from 46% to 55%.
Inventory & Supply
Inventory & Supply: SFD
Source: Metrostudy
Arguably the most critical issue that the Atlanta housing market currently faces is a depleted lot inventory, which effectively places a cap on the number of new homes that can be constructed – fewer lots to build on translates directly to fewer new homes being built. SFD VDL inventory is down -5.7% from the end of December and has declined by -13.4% over the last 12 months. The months’ supply has also declined on a quarterly and annual basis (-1.9% and -9.0%) but took less of a hit given the corresponding drop in starts over those same time periods.
Inventory & Supply: SFA
Source: Metrostudy
SFA lot inventory and supply declined even more drastically than SFD with inventory levels declining -3.6% from the end of December and -16.7% since the end of Q1 2021. Demand for attached housing from both builders and buyers has skyrocketed over the last 12 months, and the months’ supply for attached lots fell -2.9% in Q1 and has decreased by -26.9% since Q1 2021. Considering that SFA lot deliveries increased by +8.4% and inventory levels still fell by -16.7% gives some additional perspective on how strong demand is for this product type.
Market Leaders
Starts Leaders
Source: Metrostudy
Gwinnett County (4,031 annual starts) continues to lead the Metro area in housing starts and has commenced construction on approximately 1,800 more homes over the last 12 months as compared to the next most-active county, Cherokee (2,240 starts). Forsyth, Cobb, and DeKalb counties rounded out the top five in Q1, combining for 5,600 starts over the last 12 months. The most notable housing start movements since Q1 2021 include a +75.5% increase in Dawson County, a +51.5% increase in Bartow County, and a -45.8% decline in Clayton County.
Lot Delivery Leaders
Closings Leaders
Source: Metrostudy
Given its dominance in housing starts, it is no surprise that Gwinnett County also leads the Metro area in new home closings. Annualized home sales in Gwinnett eclipsed 4,000 in Q1, more than #2 Cherokee County (2,064) and #3 Forsyth County (1,972) combined; Dekalb and Cobb counties round out the top five in Q1. The most notable jumps in new home closings came from Spalding County (+44.7%) and Bartow County (+36.5%), whereas closings in both the Clayton County (-32.0%) and South Fulton County (-27.4%) submarkets contracted significantly.
Source: Metrostudy
As with starts and new home closings, Gwinnett County led Metro Atlanta in lot deliveries in Q1, increasing production by +32.4% to deliver an annualized 4,472 lots to the market. South Fulton, Henry, Cherokee, and Cobb counties filled out the top five and combined to add an annualized 6,023 lots. Of the 23 counties included in this analysis, 14 (60.9%) experienced double- or triple-digit increases to annual lot production in Q1, whereas 7 (30.4%) counties experienced double-digit decreases in production. Note that the majority of lots being delivered are spoken for by builders prior to the start of development, so these delivery increases aren’t necessarily improving supply.
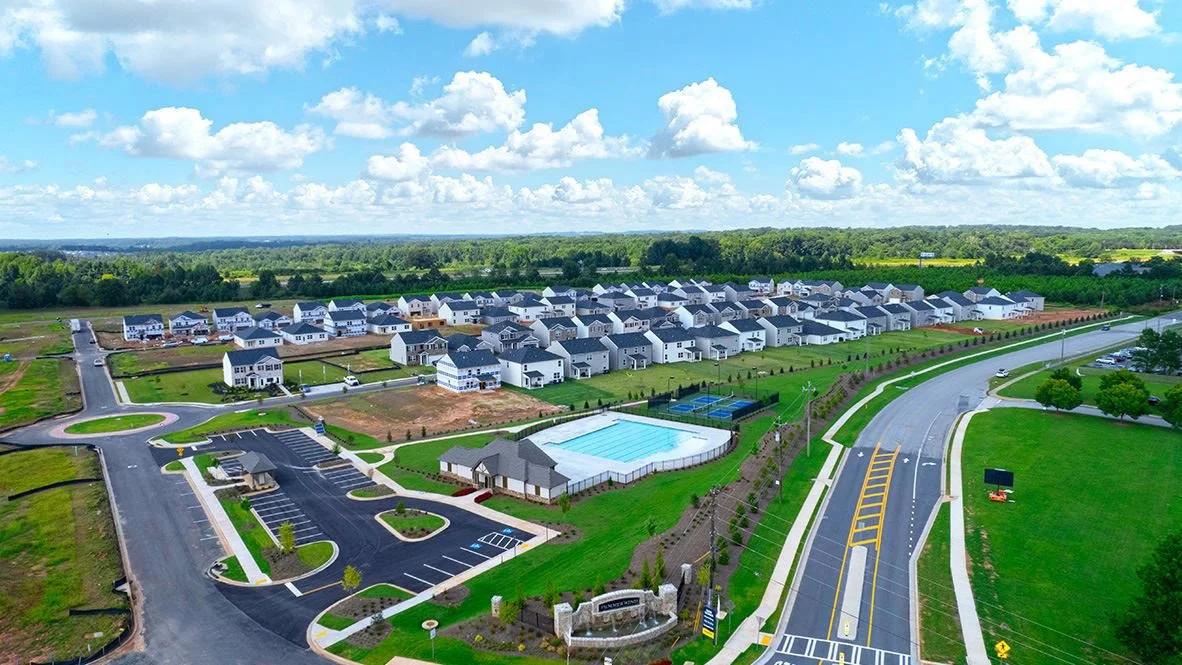
Townes of Auburn in Barrow County (Image Credit: Rocklyn Homes)
Summerwind in Gwinnett County (Image Credit: BuzzBuzzHome.com)
Most Active Communities
Source: Metrostudy/Zonda
The map to the right provides a visual summary of the top-performing communities in Metro Atlanta over the last 12 months. After diving deeper into the characterstics of these communities, here are a few key takeaways:
8 of the top 10 communties are concentrated in the NE quadrant of the Metro area.
9 of the top 10 communities are located more than 30 miles from Atlanta’s urban core in submarkets once considered too far from the city center to be viable for large-scale residential development.
As of the end of Q1, all 10 communities on this list had less than a 1-year supply of finished lots, and it’s extremely likely that the 6 communities on this list with no future lots planned (1, 2, 4, 6, 7, 9) will close out before the end of the year.
Leading Builders
Source: Metrostudy
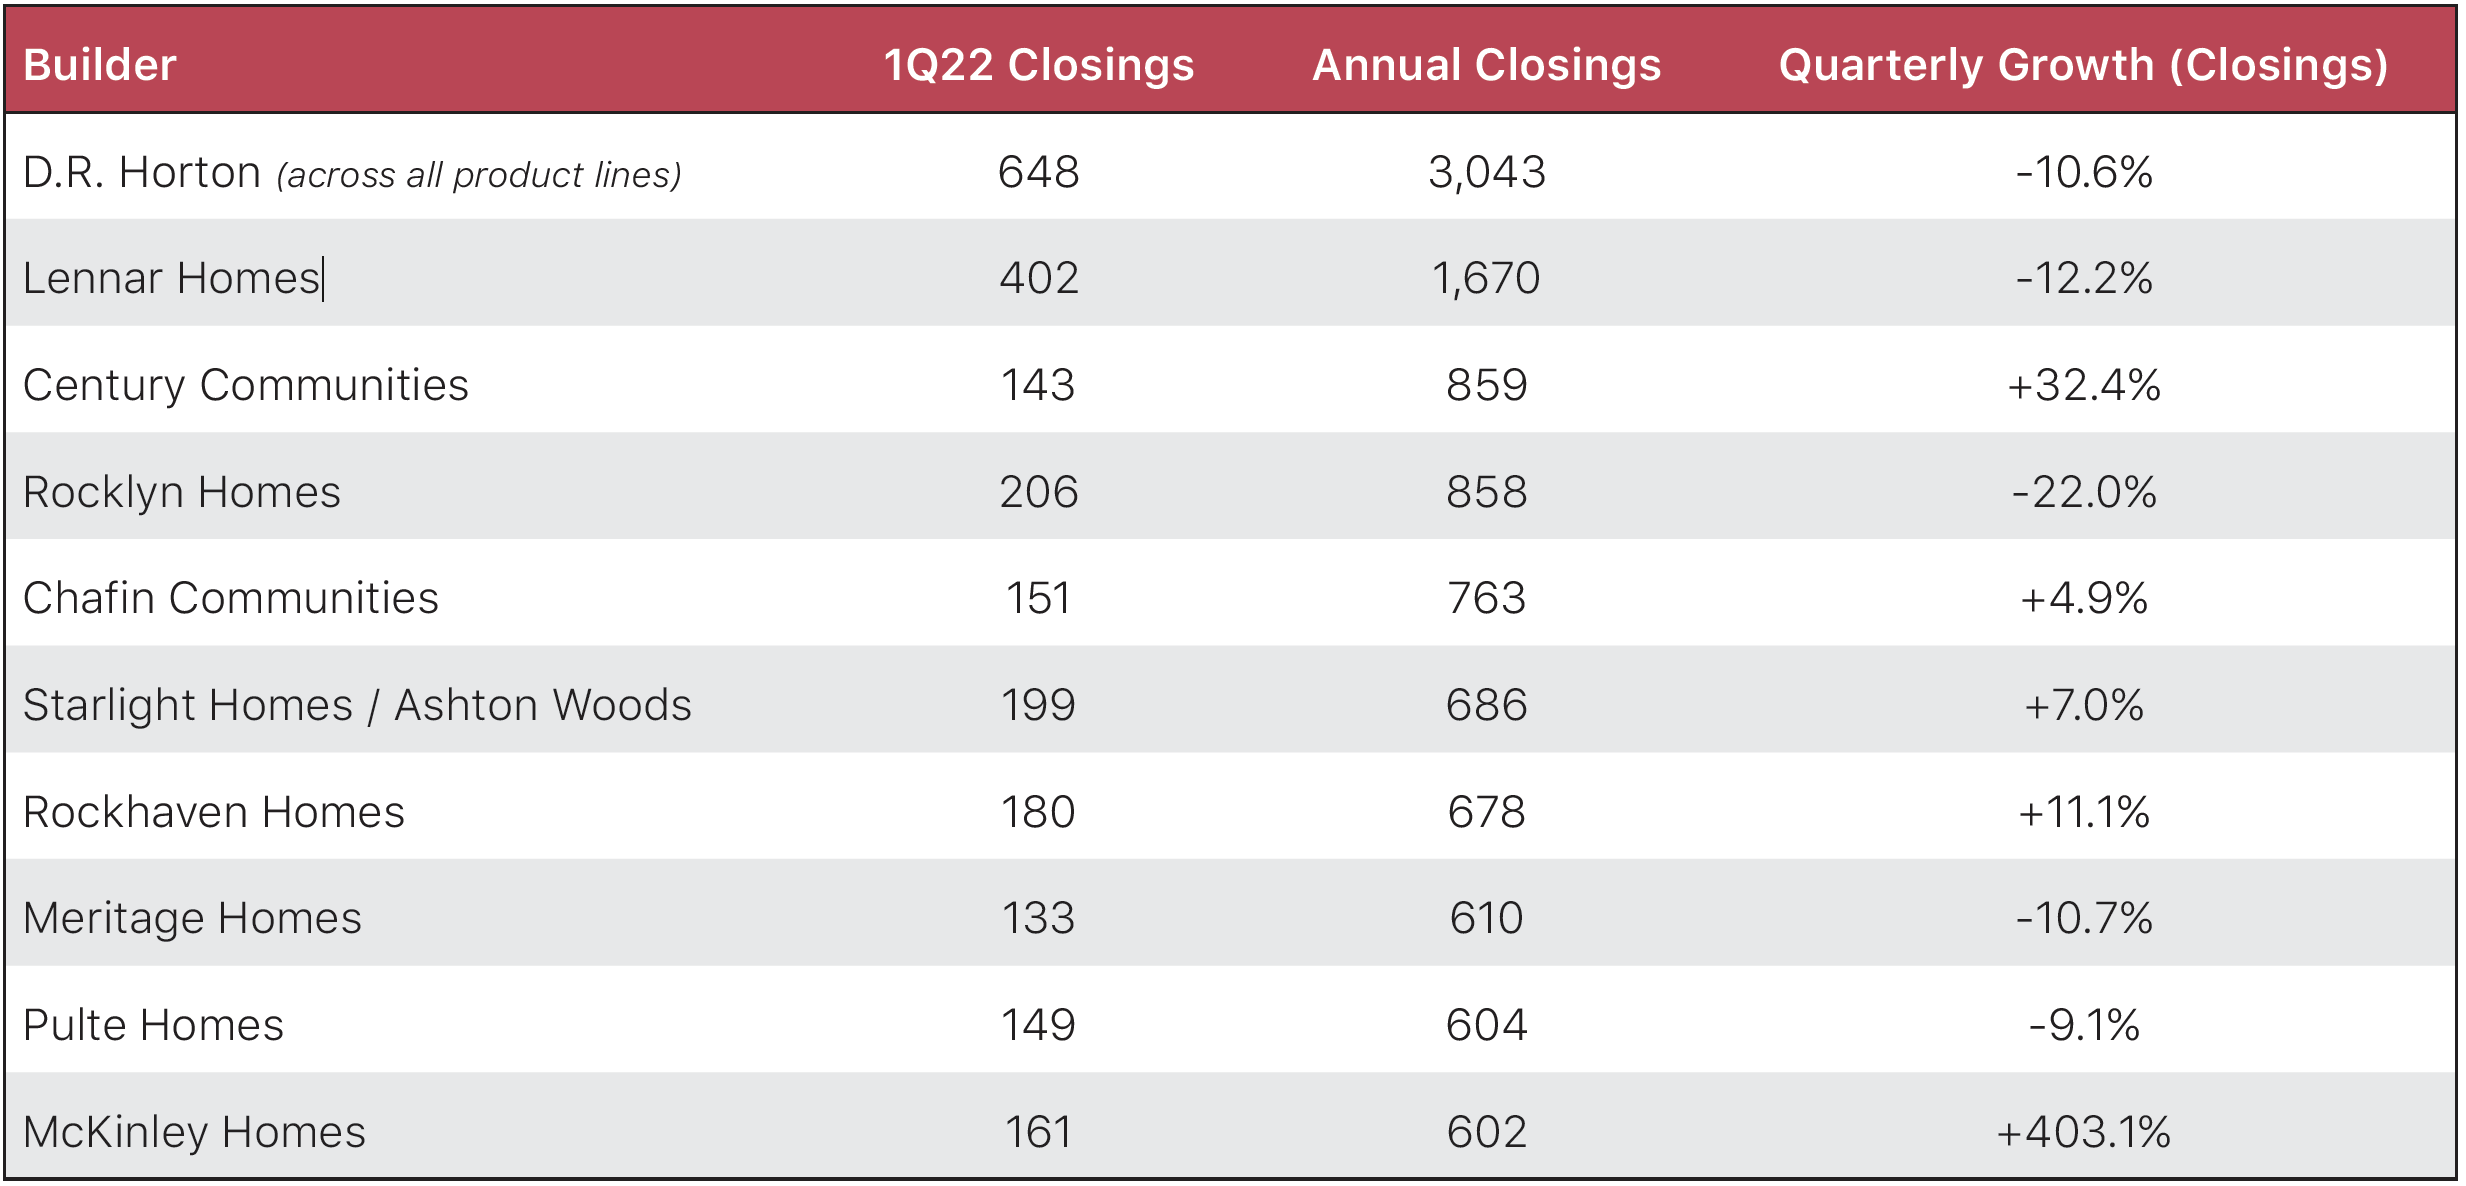
Despite a slight dip in their annualized product, D.R. Horton led the Metro Atlanta in new home closings in Q1 with a combined 725 closings across their product lines (3,375 over the last 12 months). The top five is rounded out by Lennar (402), Century Communities (143), Rocklyn Homes (206), and Chafin Communities (151). Of the five builders that increased home production in Q1, the most notable increases came from McKinley Homes (+403.1%) and Century Communities (+32.4%). On the opposite end, Rocklyn Homes (-22.0%) and Lennar (-12.2%) had the most notable declines in production during Q1. Note that these decreases in production are not a symptom of diminishing demand, rather they are evidence of builders’ continued issues with materials availability, pricing, labor, and lot inventory.
Conclusion
We all knew it was coming – we understood that the Atlanta housing market’s record growth over the last 20+ months was due to an unsustainable imbalance between supply and demand and that growth would eventually be forced back to more normal levels. And that’s exactly what we saw begin to happen in Q1. The pattern that we’ve begun to see emerge in Atlanta and other major housing markets across the U.S. can be simplified as follows:
Based on the market’s trajectory prior to the onset of the COVID-19 pandemic as well as activity since emerging from the recession in 2020, we believe that the following factors will underpin Atlanta’s housing market through the summer months and into the Fall:
Shifting Demand: Demographic shifts, most notably the Atlanta region’s 900K+ Millennial population either in or approaching the home buying “sweet spot” (31-34 years), will keep demand from bottoming out, but rising home prices and interest rates will eliminate an increasing number of potential buyers from the market (most notably from the Millennial-dominated first-time and first-move up buyer segments). This expected pullback in demand should result in increases to the housing inventory and supply, restoring some balance to Atlanta’s supply/demand dynamic.
Continued Affordability Challenges: As mentioned previously in this report, the Federal Reserve Bank declared the Atlanta housing market as “unaffordable” for the first time since they began tracking this metric in 2006. For perspective, the median home price in Atlanta at the end of 2019 was $270,000; at the end of Q1, the median price was $395,000. Increasing home prices combined with rising interest rates and inflation impacts has pushed home price growth far past a level considered sustainable for this market. While we expect that prices of both new and existing homes will continue to rise through the summer selling season based on the limited inventory alone, we believe that monthly and annualized growth will return to more normal levels as high prices eliminate a growing number of potential buyers from the market.
Ongoing Supply Chain Issues: The homebuilding industry, like many sectors of the U.S. economy, is still feeling significant effects from disrupted supply chains. The majority of builders continue to report critical shortages of key materials ranging from copper wire and appliances to exterior doors and windows. And because these materials continue to be hard to come by, their prices continues to climb. According to U.S. Census Bureau, home construction costs in Atlanta have increased by +17.2% over the last 12 months (compared to +11.6% annual growth nationally) as a result of supply chain issues and the increased prices of both materials and the land/homesites themselves.
For information about market research & reporting, including custom market reports, please contact Katie Fidler at katief@stbourke.com.


