National: 3Q2022
Housing Market Analysis
National Housing Market Analysis
Q3 was defined by mixed messages: inflation remains high, but unemployment remains low. Negative GDP growth in Q1 and Q2 led to near-constant warnings of a looming recession, but national GDP actually expanded by +2.6% during Q3 (first estimate). Homebuilders are reporting double-digit decreases in contracts and sales but also reporting double-digit increases in annual revenue. Single-family housing starts are down, but multifamily starts remain well above their long-term average. The CPI continued to climb, but so did the average wage. So, what does this mean?
It means that you’ve been handed a partially-filled glass. Based on how you interpret what’s in front of you, that glass is either half-full or half-empty. In terms of the economy, if you want to believe that we are headed towards a painful recession, there are data points to support that. If you want to believe that the Federal Reserve Bank’s efforts to combat inflation are beginning to work and that the economy is headed towards a “soft landing” in 2023, there are data points to support that, too.
“The Fed is not anywhere close to a pause or a pivot. They are laser-focused on breaking inflation. A key question is what else they might break.”
Bill Zox
Portfolio Manager, Brandywine Global
This uncertainty led to a noticeable shift in sentiment across the housing industry in Q3. When rebounding from the onset of the pandemic in 2020, the housing market was arguably the brightest spot in the U.S. economy. Prices were moderate and generally affordable, mortgage rates were low, supply was plentiful, and people were desperate for more space. We enjoyed nearly 18 straight months of record sales and price increases before the market began showing signs of cooling in January - a trajectory on which the housing market as continued throughout 2022. The following factors had a significant impact on the housing market in Q3:
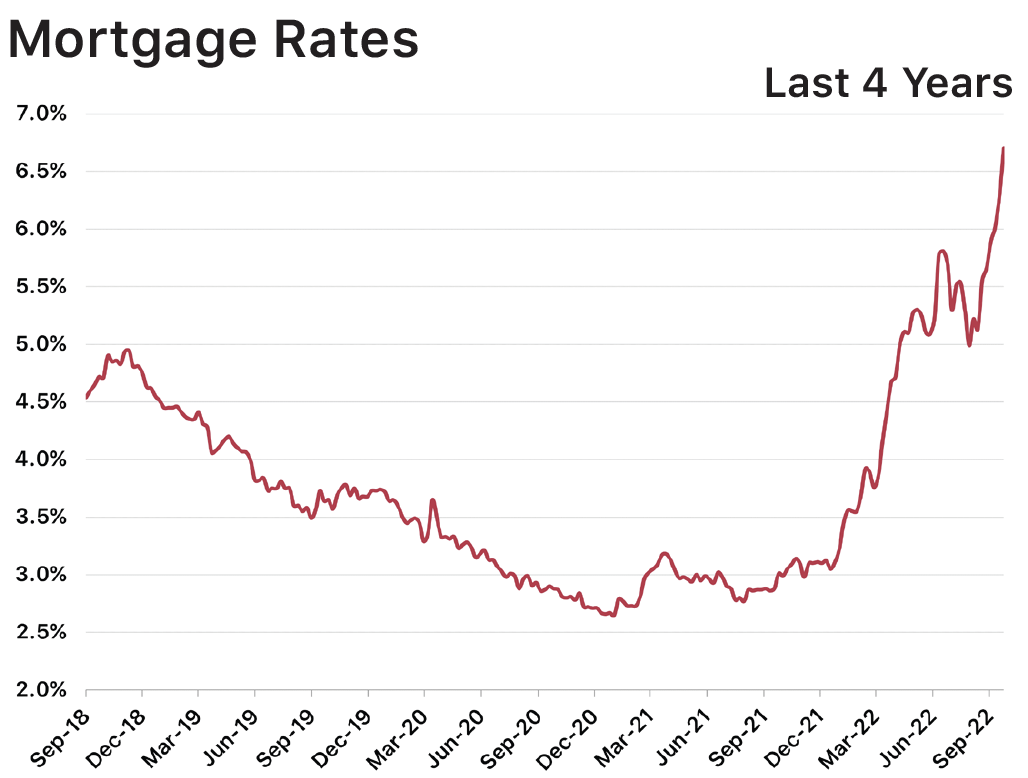
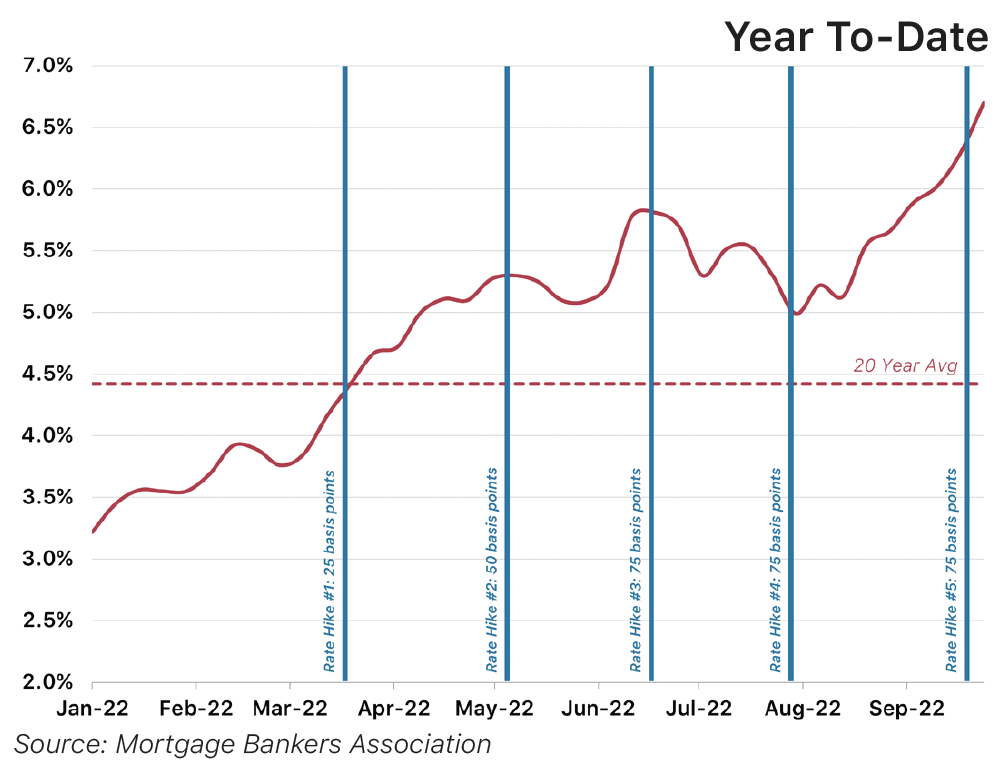
Mortgage Rates: Mortgage rates continued their steep upward trajectory in Q3, climbing an additional 100 basis points to 6.70% by the end of September. From a financial standpoint, this rate increase is adding hundreds of dollars to monthly mortgage payments, contributing to the further erosion of affordability, and reducing the pool of eligible buyers. From a psychological standpoint, the dramatic increase has persuaded many would-be buyers to delay their home purchases, even if they could afford to absorb the additional monetary expense.
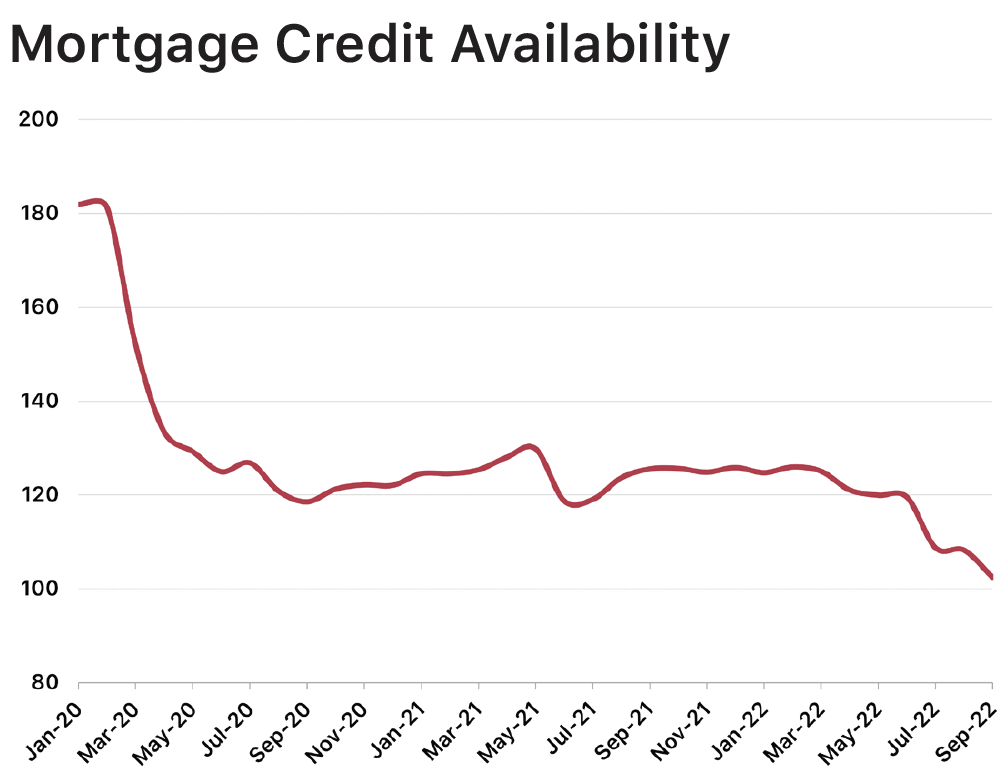
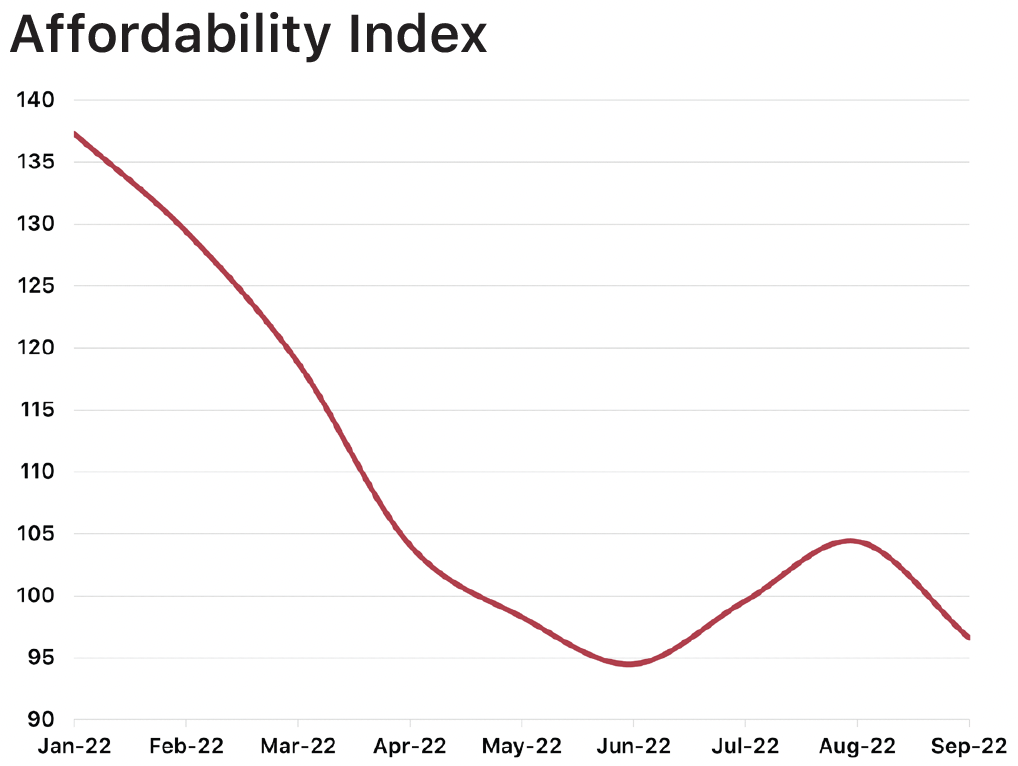
Affordability: While the Affordability Index improved modestly during Q3, it has declined -28% over the last 12 months and remains well below the long-term average. The Mortgage Credit Availability Index hit its lowest level in 9 years during Q3, indicating that is becoming more challenging to qualify for a mortgage based on current financial requirements. Increasing mortgage rates are adding hundreds of dollars to monthly mortgage payments, and home prices remain significantly higher than they were 12 months ago (+15% new homes, +9% existing homes).
Declining Starts & Sales: High home prices and rising mortgage rates have had a significant impact on demand as evidenced by the -28% decline in new home sales and -22% decline in existing home sales since the start of the year. Most homebuilders have responded to this pullback in demand by reducing the number of new homes they start; while this measure is reducing builder risk and exposure in the short and medium term, it is ensuring that the U.S. housing stock will remain significantly undersupplied for the foreseeable future.
Sources: U.S. Census Bureau, Bureau of Labor Statistics, National Association of Realtors, LendingTree, National Association of Homebuilders, Bloomberg, Bureau of Econmic Analysis
The data provided in this report has been interpreted and analyzed through the lens of residential land development and home construction. Understanding key metrics and their implications is essential to making informed business decisions and remaining flexible as an organization, especially during these unprecedented times.
“Buyer traffic is weak in many markets as more consumers remain on the sidelines due to high mortgage rates and home prices that are putting a new home purchase out of financial reach for many households.”
Jerry Konter
Chairman, National Association of Home Builders
KEY MACROECONOMIC METRICS
Source: Bureau of Labor Statistics
Source: Bureau of Labor Statistics
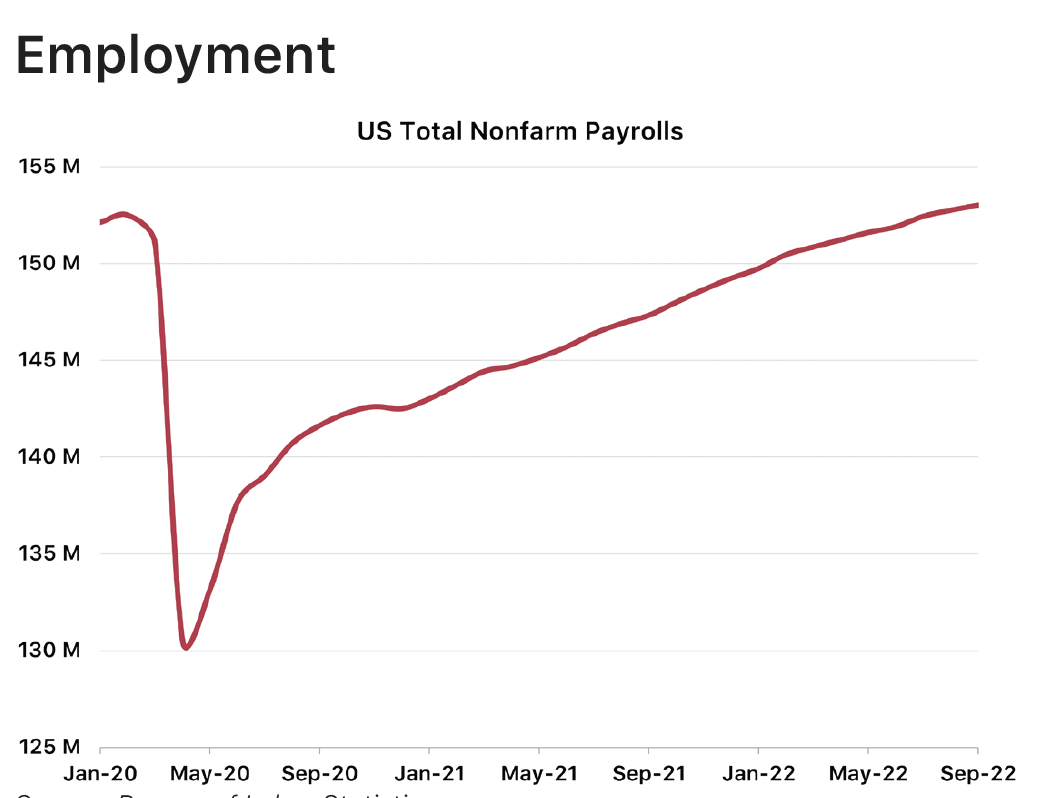
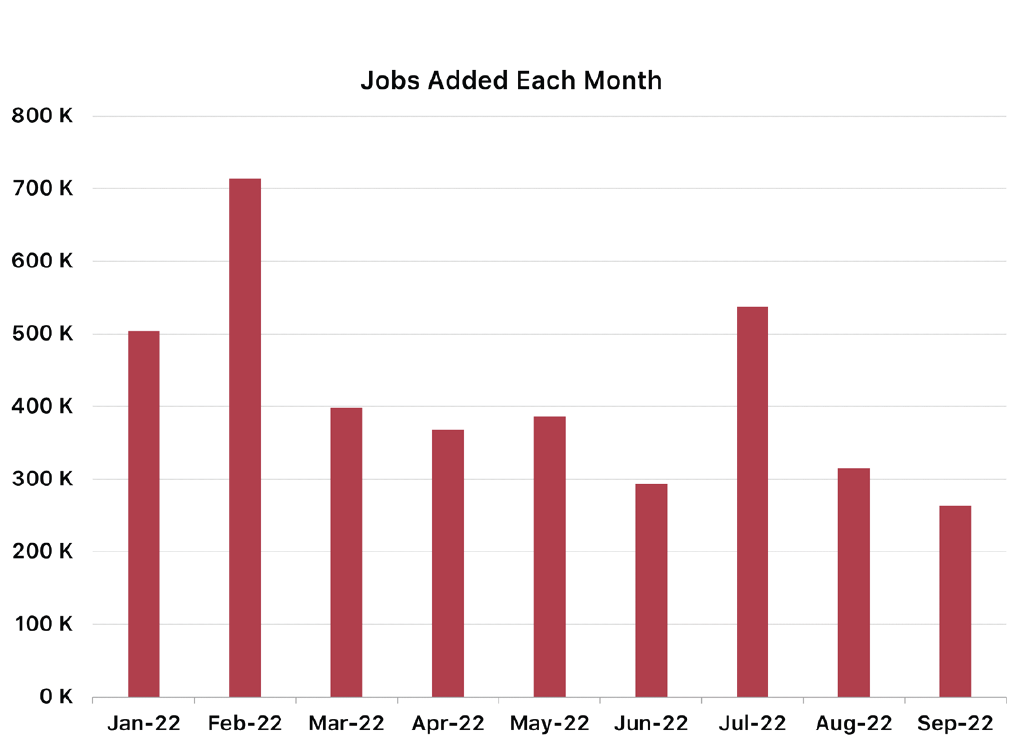
A bright spot in the national economy continues to be employment. Despite stubborn inflation and growing fears of a recession, the U.S. added +1.1 M jobs in Q3 and has added +3.8 M jobs since the beginning of the year. The unemployment rate remains below 4%, considered “full employment,” and we expect seasonal hirings during Q4 to keep employment on its upward trajectory through the end of the year.
Source: Bureau of Labor Statistics
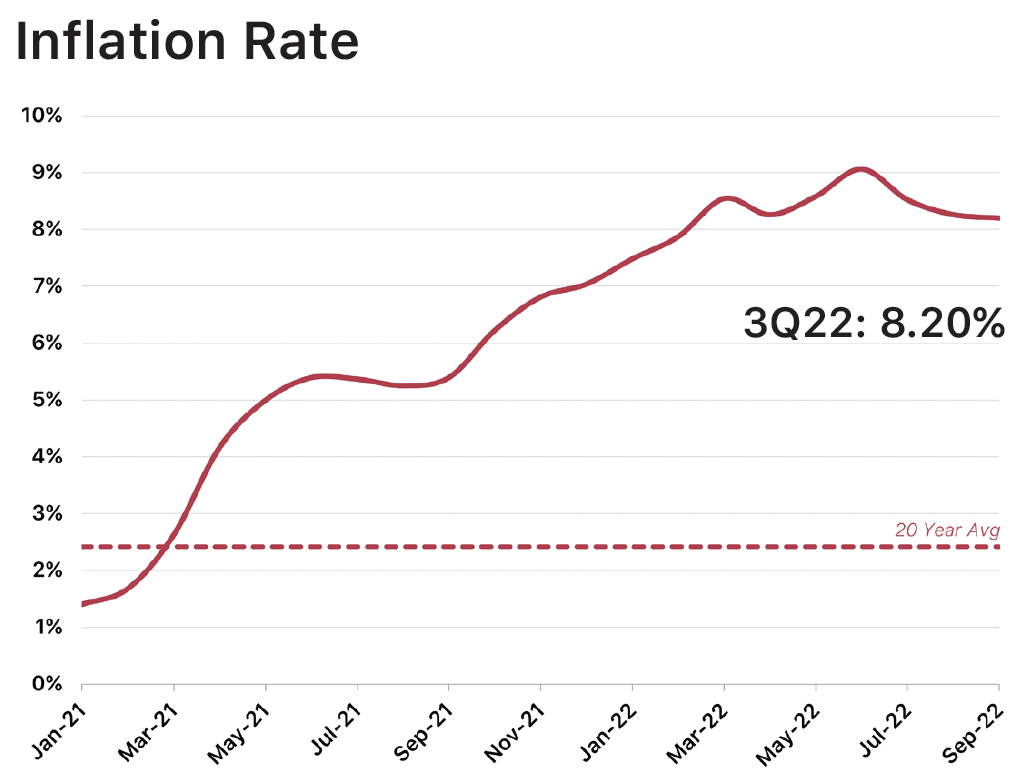
The Federal Reserve Bank increased rates twice during Q3 (150 total basis points) in an effort to curb inflation, however inflation remained sticky during this period. Inflation fell from 9.06% in Q2 to 8.20% in Q3, well below the expectations (and hopes) of national economists. The Fed is committed to reducing inflation and is expected to increase rates by another 150 basis points before the end of 2022. The current sentiment is that it will likely be 2025 before inflation returns to the Fed’s 2% benchmark.
Source: Bureau of Labor Statistics
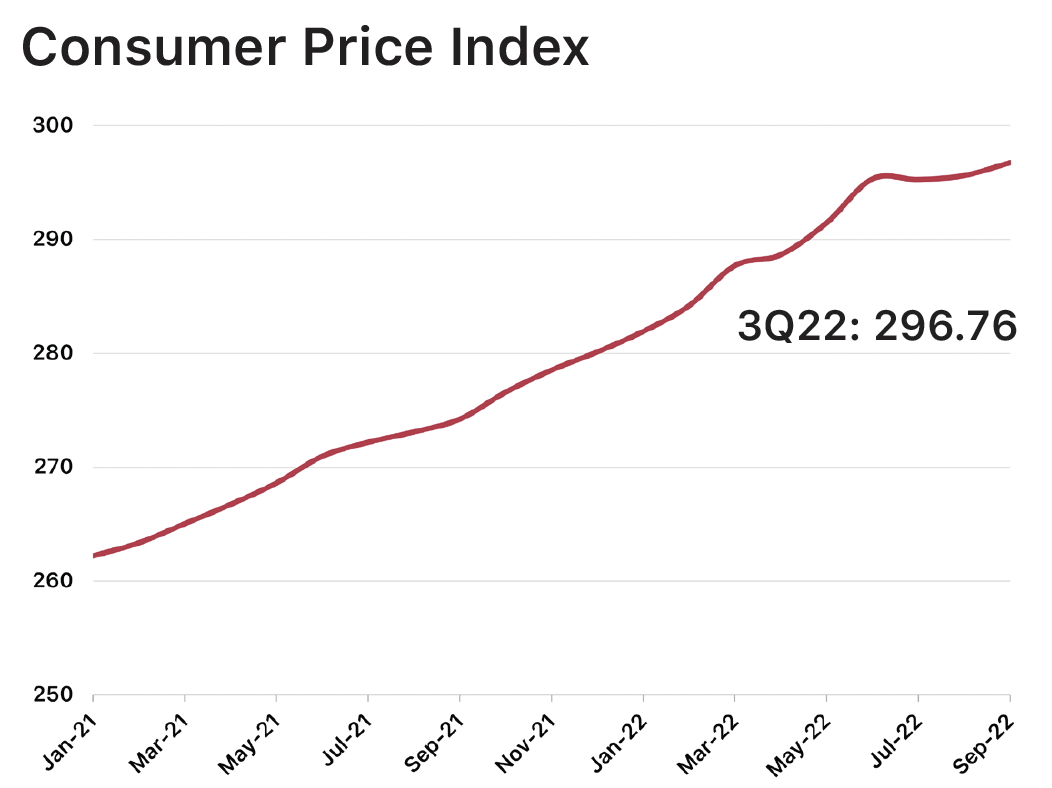
The Consumer Price Index remained relatively flat during Q3, increasing by +0.48% from Q2 and by +8.22% since the beginning of the year. Ideally, we would have seen the CPI decline during Q3, however it’s encouraging to note that the rate of CPI increases has declined significantly; the +0.48% increase in Q3 is a notable improvement over the +2.65% increase we saw in Q2 and the +2.71% increase we saw in Q1. In Q3, declining gas and energy process were largely offset by increases in food, shelter, and medical care.
Source: Bureau of Economic Analysis
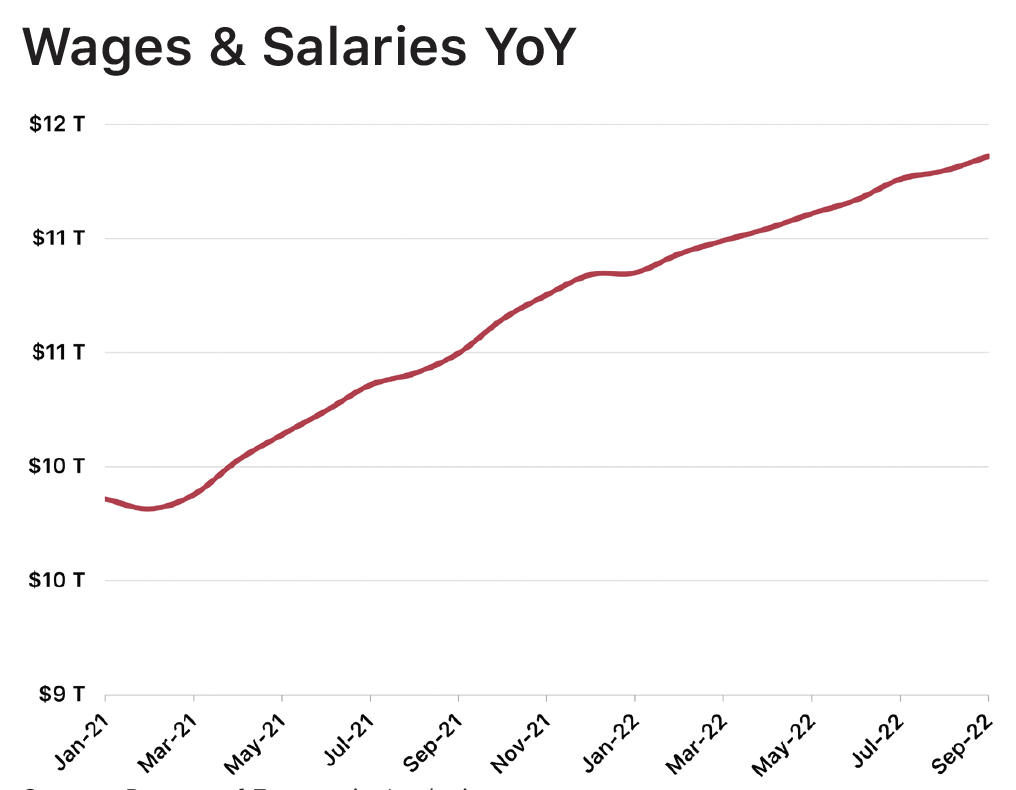
Wages & salaries continued their upward trajectory in Q3, increasing by +1.7% from the end of June. Wages & salaries have increased by +4.8% since the start of the year and by +8.2% over the last 12 months. While +8% annual growth is well above the long term average, it’s worth noting that the annual growth has decelerated for 6 consecutive months. Additionally, this annual increase is largely being offset by high inflation and the comparatively high costs of consumer goods and services.
Source: University of Michigan Surveys of Consumers
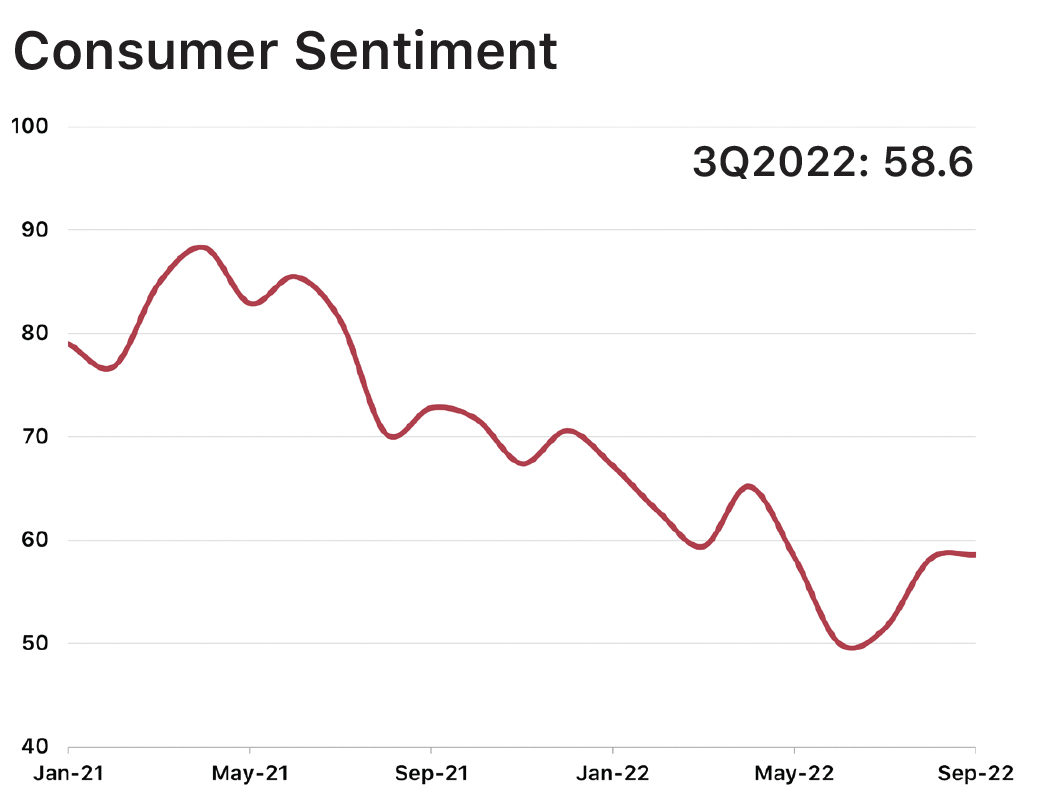
After hitting the lowest level on record (50.0) at the end of Q2, Consumer Sentiment rebounded modestly during Q3 to 58.6 and currently stands at a 5-month high. This rebound was driven by a noticeable drop in gas prices combined with strong jobs reports but kept in check due to modest declines in the long-term outlook of business conditions and fears of a looming recession. Despite Q3’s bump, Consumer Sentiment is down -17.0% since January and -19.5% over the last 12 months and is expected to remain well below the long-term average level as consumers contend with the economy’s mixed signals.
Source: YCharts
Source: YCharts
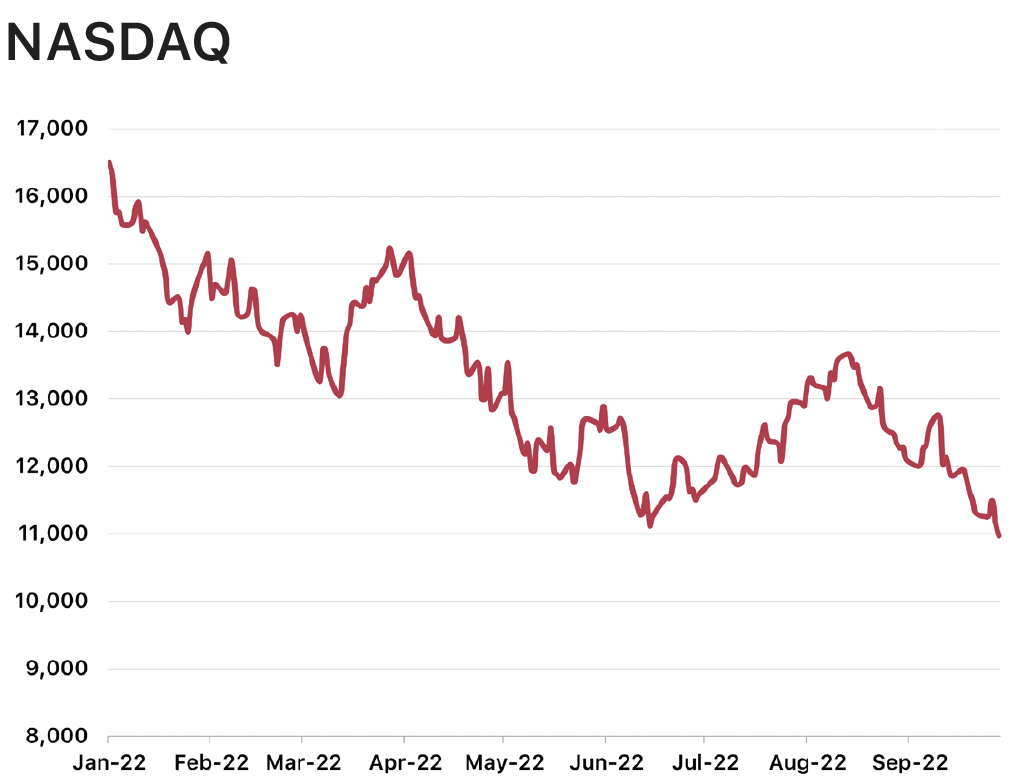
The stock market rebounded to its highest level since mid-April in August following a strong jobs report and declining energy prices but reverted to a downward trajectory through the end of August and September. The S&P 500 Index declined by -4.9% during Q3 and is down -23.9% since the beginning of the year. The NASDAQ posted similar numbers, declining by -4.6% during Q3 and by -32.8% since the start of the year. Movements in the stock market are volatile from day-to-day and are being heavily influenced by factors including inflation, tightening monetary policy (rate hikes), high interest rates, and geopolitical instability (namely the Russian-Ukraine conflict).
KEY HOUSING METRICS
Source: Mortgage Bankers Association
Source: Mortgage Bankers Association
Mortgage rates appeared to be relaxing slightly through the first part of Q3 but quickly changed course following late July’s 75-basis point increase to the Fed Funds Rate. The Fed instituted two rate hikes during Q3 (July and September) totaling 150 basis points in an aggressive effort to curb inflation, which ultimately pushed the 30-year mortgage rate to 6.70% by the end of Q3 (highest level since July 2006). This uptick in interest rates is adding an estimated $259 to the monthly mortgage payment of a median-priced home, which translates to an additional +$3,100 per year and +$93,100 over the life of the loan (varies by loan term, state, and market).
Source: Mortgage Bankers Associations
The Mortgage Credit Availability Index, which measures how difficult it is to obtain a mortgage based on current lending standards, accelerated its decline during Q3. The MCAI fell by -14.3% during Q3 to its lowest level since March 2013 and has declined by -18.6% since the beginning of the year. This tightening of the MCAI indicates that lending standards are becoming more robust as lenders prepare for the potential of a recession and the increasing threat of mortgage delinquencies and defaults.
Source: National Association of Realtors
The Affordability Index rebounded modestly in August but fell below the baseline level of 100 again in September to 96.6, indicating that the typical American family can no longer afford a median-priced home. The Affordability Index has declined by -29.6% since January and by -34.2% over the last 12 months. While demand for housing still exists, buyers are much less willing to overpay and are looking to recoup some of the additional mortgage expenses through discounts to the home price.
Source: National Association of Homebuilders
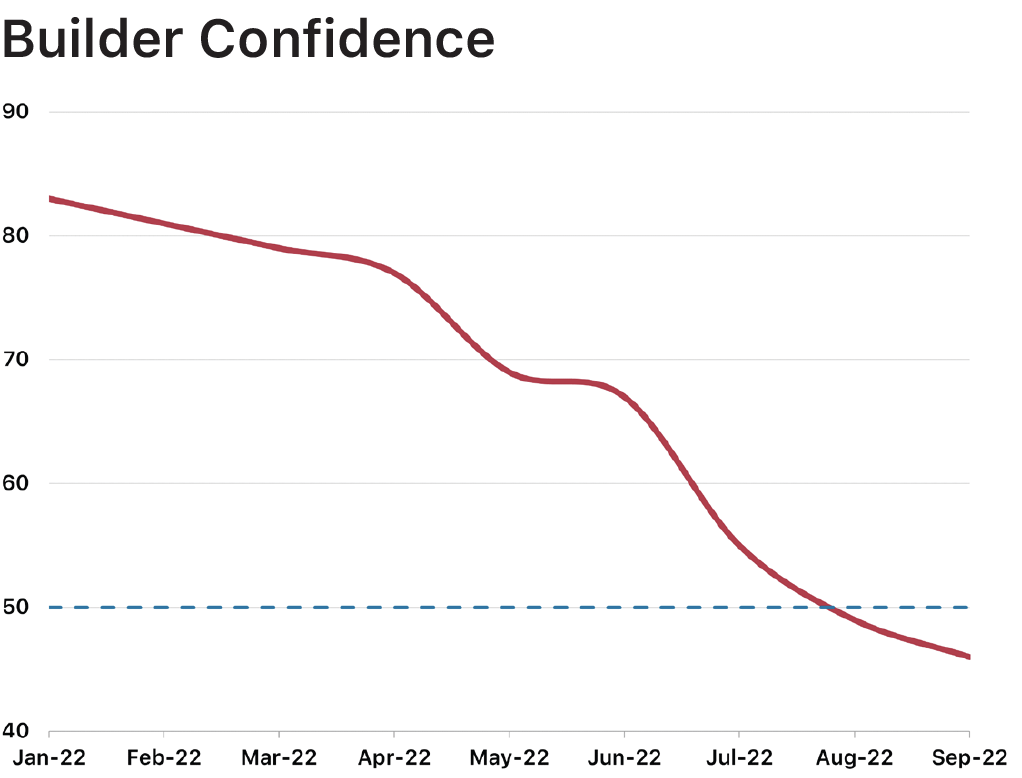
Builder Confidence continued on its downward trajectory through Q3, falling below the baseline level of 50 in August and reaching its lowest level since May 2020 in September. Builders are having to adapt in order to keep sales afloat; 24% of builders reported cutting home prices in September, and 50% of builders have reintroduced incentives ranging from rate buy downs to free amenities and discounted home upgrades.
Source: U.S. Census Bureau
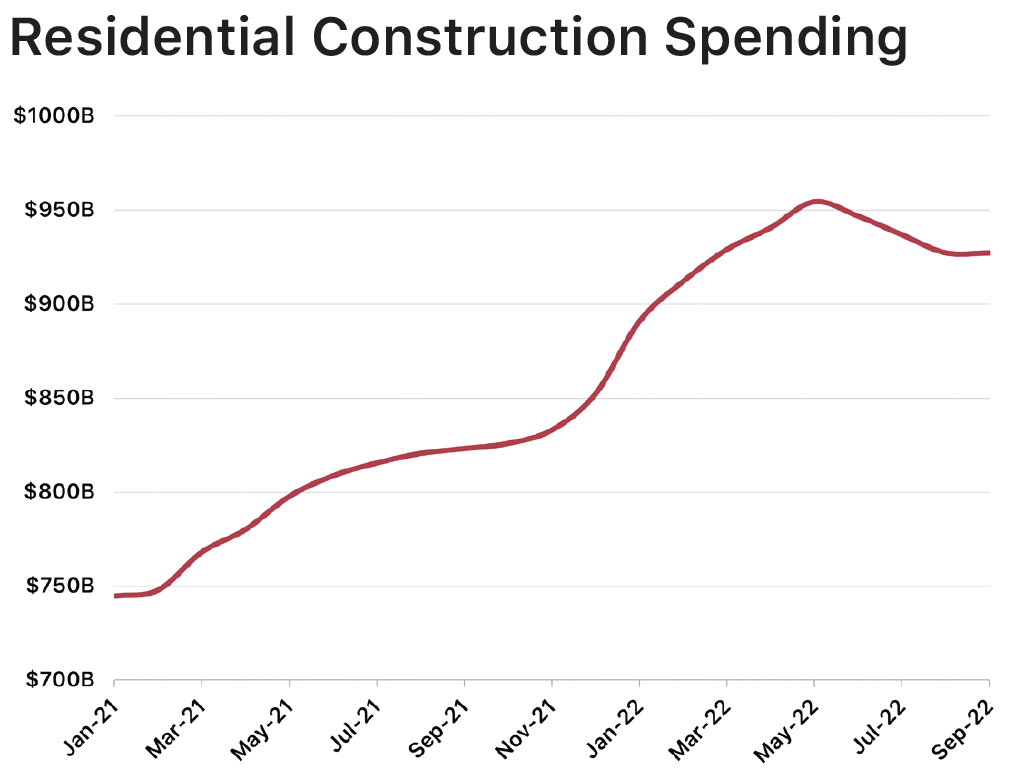
U.S. residential construction spending declined for the fourth straight month in September, ending Q3 at $927.25 B. While residential construction spending declined modestly during Q3 (-2.1%), it remains elevated on both a year-to-date (+8.8%) and annual (+12.7%) basis. We expect a further pullback in residential construction spending over the coming months based on supressed demand and declining starts and construction activity.
HOUSING METRICS - NEW HOMES
Source: U.S. Census Bureau
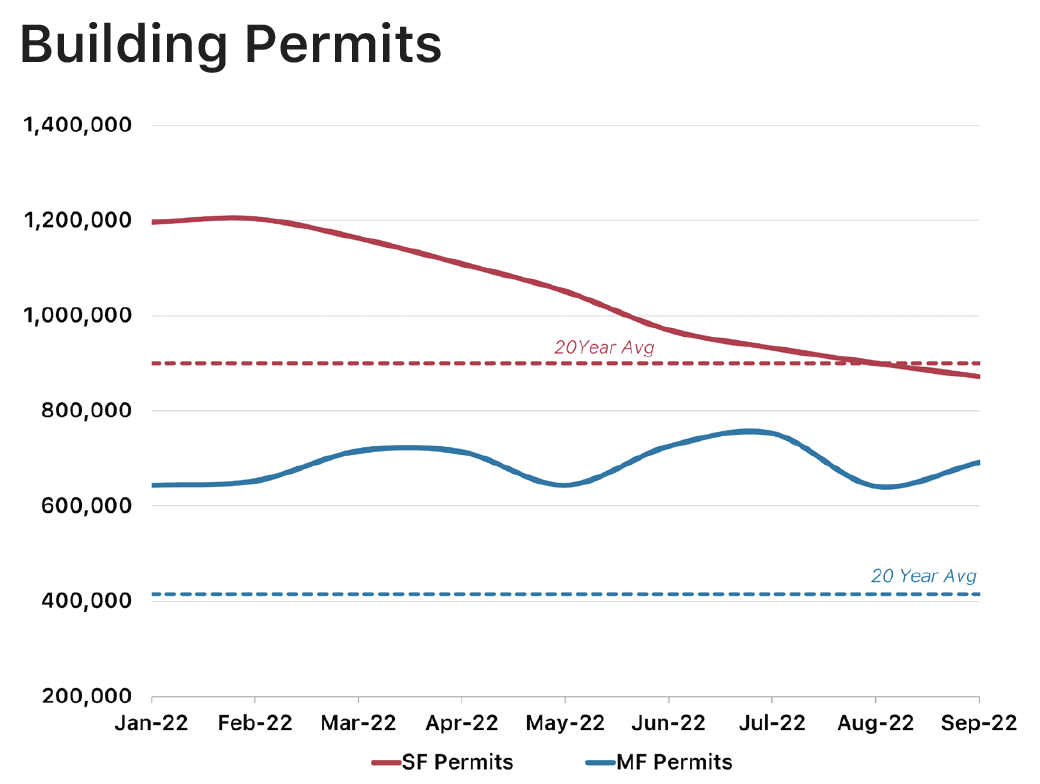
Annualized single-family permits have declined for 7 straight months, dipping below the 20-year average for the first time since the height of the pandemic (June 2020) during Q3. SF permits declined by -10.1% during Q3 and are down -22.0% since the beginning of the year. Multifamily permit activity has fared better and remains well above the 20-year average; MF permits declined by -4.7% during Q3 but have increased by +23.4% on an annual basis.
Source: U.S. Census Bureau
Annualized SF housing starts reflected the pullback in demand we saw during Q3. SF starts have declined by -11.9% since the end of June and are down -26.4% since the start of the year. Annualized completions, however, increased during Q3 and have posted both year-to-date (+3.5%) and annual (+11.1%) gains. Note that due to extended construction timeframes, it’s likely that most of these contracts were locked in 8-10 months ago when home prices and mortgage rates were more palatable.
Source: U.S. Census Bureau
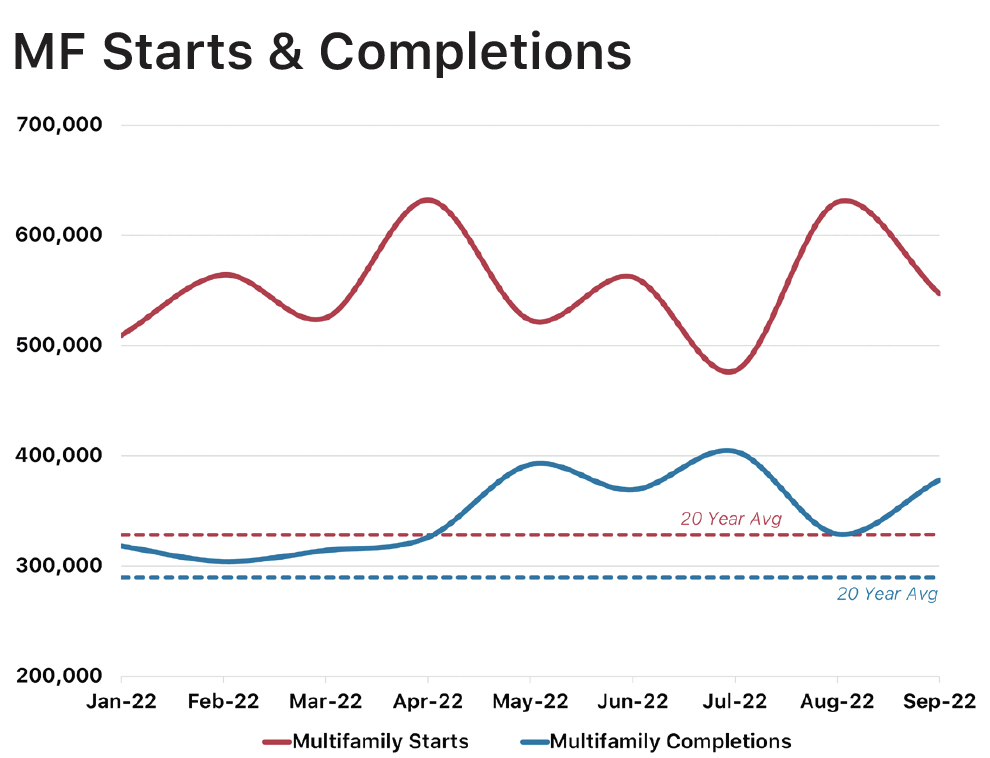
Annualized MF declined by -2.7% during Q3 and have fallen by -1.6% since the start of the year. The bright side, however, is that MF starts are +14.2% above their September 2021 level and +66.4% above the 20-year average. Annualized completions improved slightly during Q3 (+2.4%) but have posted impressive gains on both a year-to-date and annual basis (+21.2% and +30.8%, respectively). MF activity is being driven in part by the notion that high home prices and mortgage rates are forcing many would-be homebuyers, especially Millennials, to remain renters until the for-sale market stabilizes.
Source: U.S. Census Bureau
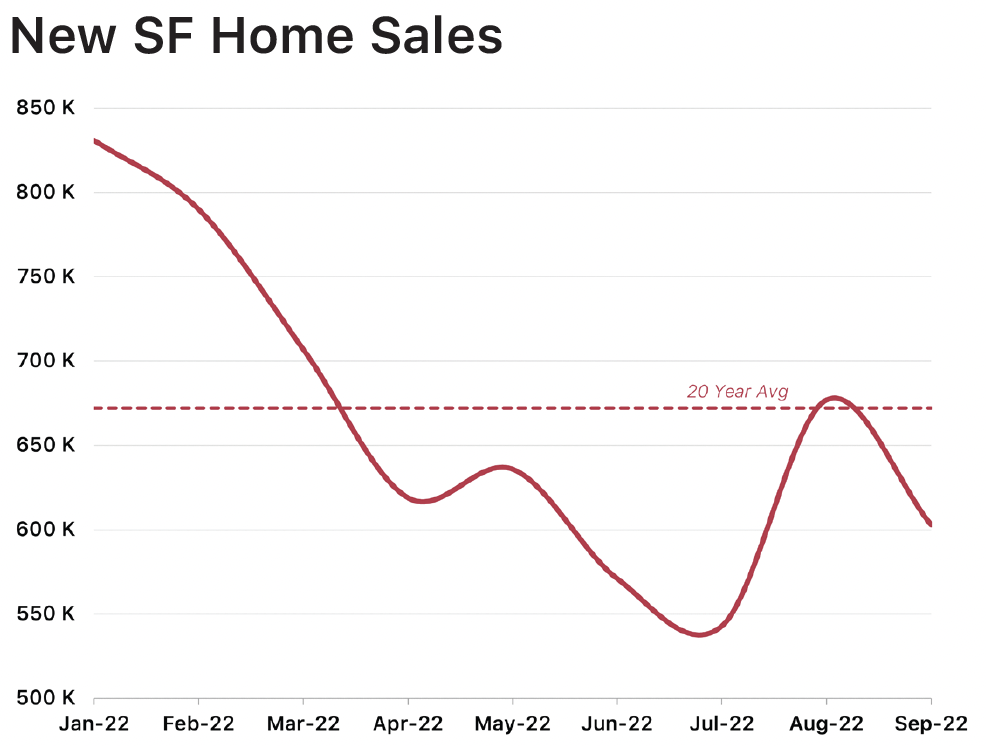
New SF home sales hit a historic low of 543K in July before rebounding modestly in August and September. SF sales improved +5.6% from their Q2 level but have declined -28.1% since the start of the year. Demand for new homes, and therefore new home sales, will likely remain below the 20-year average as would-be buyers react to factors such as high home prices, rising mortgage rates, and inflation. Additionally, most homebuilders are responding to the dip in buyer demand by reducing the number of new home starts (despite persistent issues with low supply); less starts will undoubtedly contribute to fewer sales as the market corrects itself over the coming months.
Source: U.S. Census Bureau
Source: U.S. Census Bureau
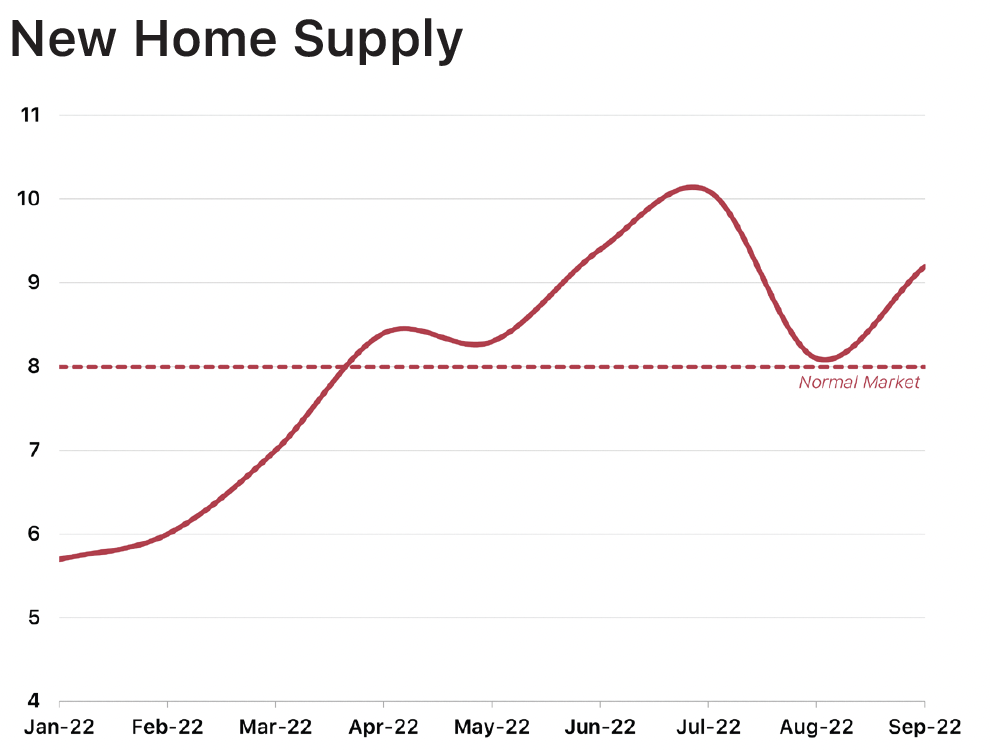
Despite the noticeable decline in new home sales and production activity since the beginning of the year, new SF home prices have remained at elevated, albeit inconsistent, levels. The median home price at the end of Q3 was $470,600 – lower than the record-high reached in July but an +8.8% increase over the last 3 months and a +14.8% increase since the start of the year. Decreasing construction costs, easing supply chains, and waning demand will likely lead to modest declines in the median sale price in the short term, however low supply will likely keep prices from bottoming out. The new home supply has improved steadily from the start of the year, increasing from 5.7 months in January to 9.2 months at the end of Q3. We expect supply levels to continue to rise moderately through the end of the year.
HOUSING METRICS - EXISTING HOMES
Source: National Association of Realtors
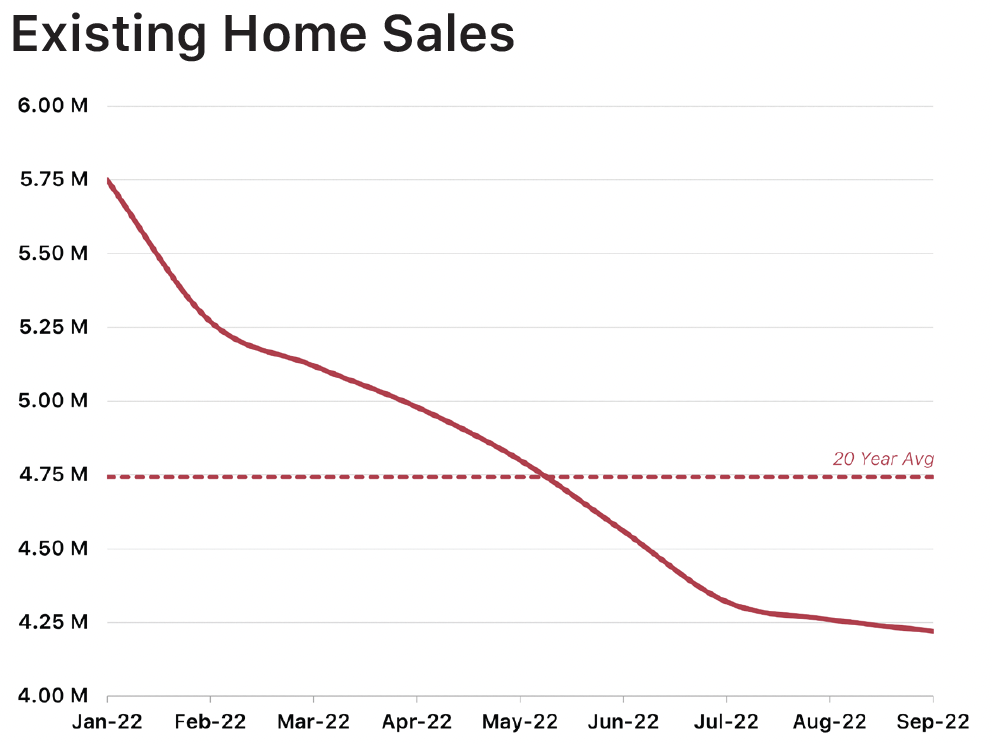
The deceleration of annualized existing home sales flattened slightly during Q3, declining by -7.5% over this period as compared to the -10.9% decline in Q2. Existing home sales are down -22.0% since the beginning of the year and stand -11.0% below the 20-year average. Like new home sales, existing home sales are being impacted by high mortgage rates and market instability influencing many would-be homebuyers to delay their purchase.
Source: U.S. Census Bureau
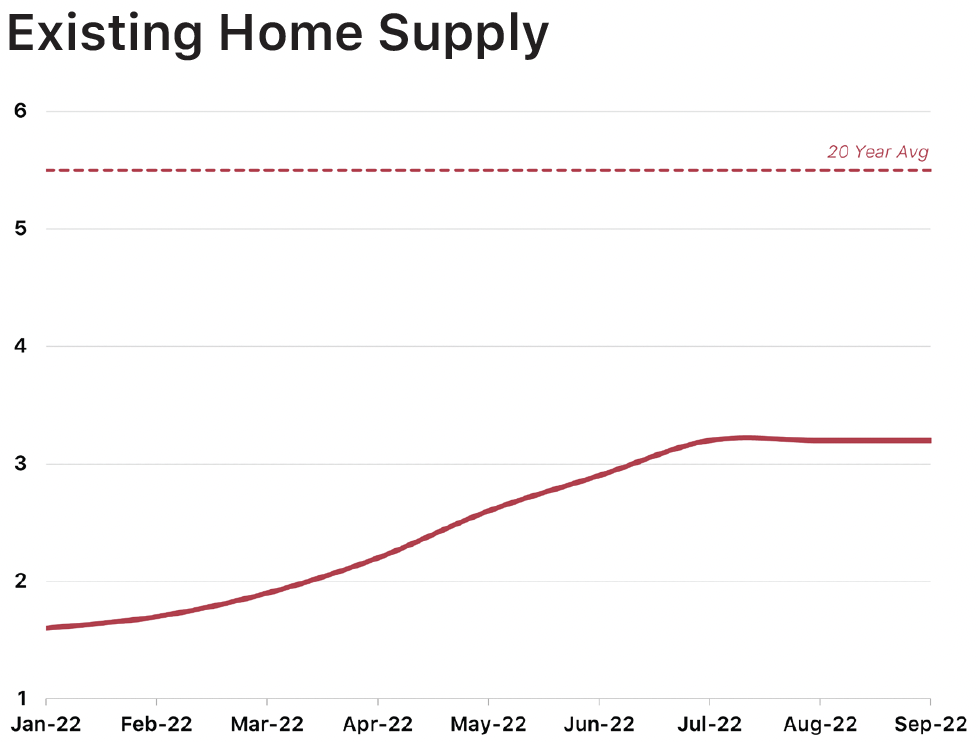
The existing home supply improved slightly during Q3, increasing from 2.9 months to 3.2 months between June and September. Inventory levels remained steady during Q3, so the uptick in supply is further evidence of subdued demand. Supply has improved significantly since the beginning of the year (up from 1.7 months in January) but remains well below the 20-year average. We expect supply to remain low as there is currently very little incentive for owners to list their current homes and move/upgrade.
Source: National Association of Realtors
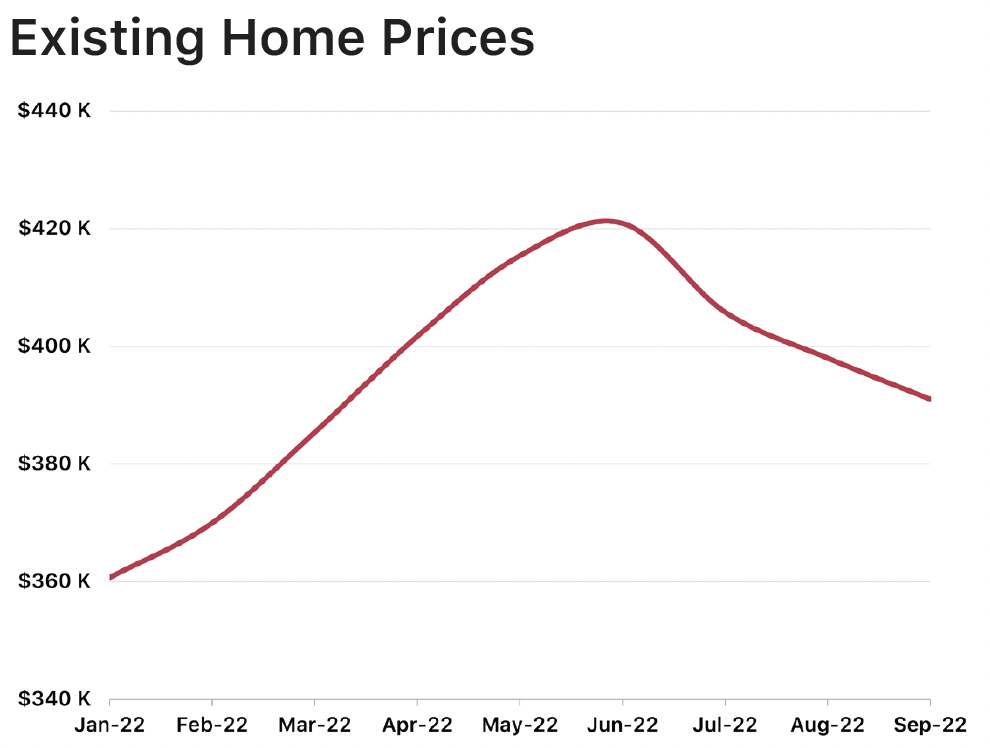
The median sale price for existing homes declined during every month of Q3, falling by -7.1% since the end of June. Despite this (much needed) price relief, prices are still up +7.0% since the beginning of the year and +8.1% over the last 12 months. Home prices have fallen due to cooling demand, and while we expect further declines during Q3 based on seasonal factors and waning demand, the low supply of homes will continue to prop prices up until supply and demand return to a more balanced state.
HOUSING METRICS - RENTALS
Source: U.S. Census Bureau
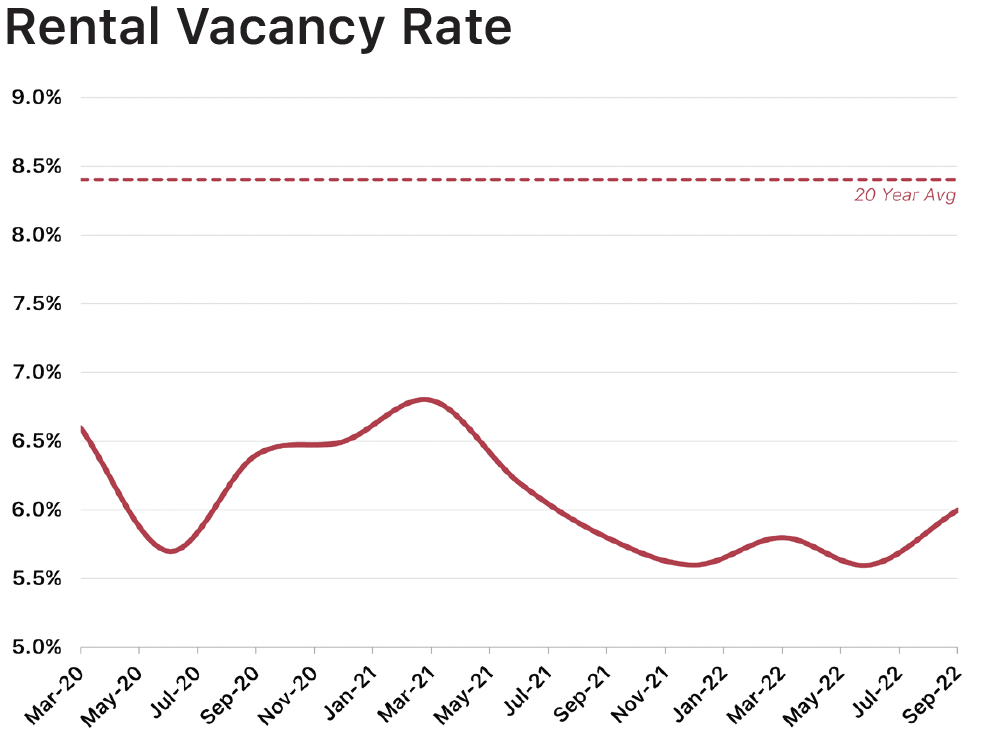
Federal, state, and local eviction moratoriums helped to keep rental vacancy rates at relatively low levels during the peak of the pandemic and through the first 12-18 months of the recovery. At present, unaffordable home prices are pushing the rental vacancy rate even lower (despite the expiration of nearly all moratoriums and rental assistance programs) as many would-be homebuyers are being forced to remain renters due to high home prices and mortgage rates.
Source: U.S. Bureau of Economic Analysis
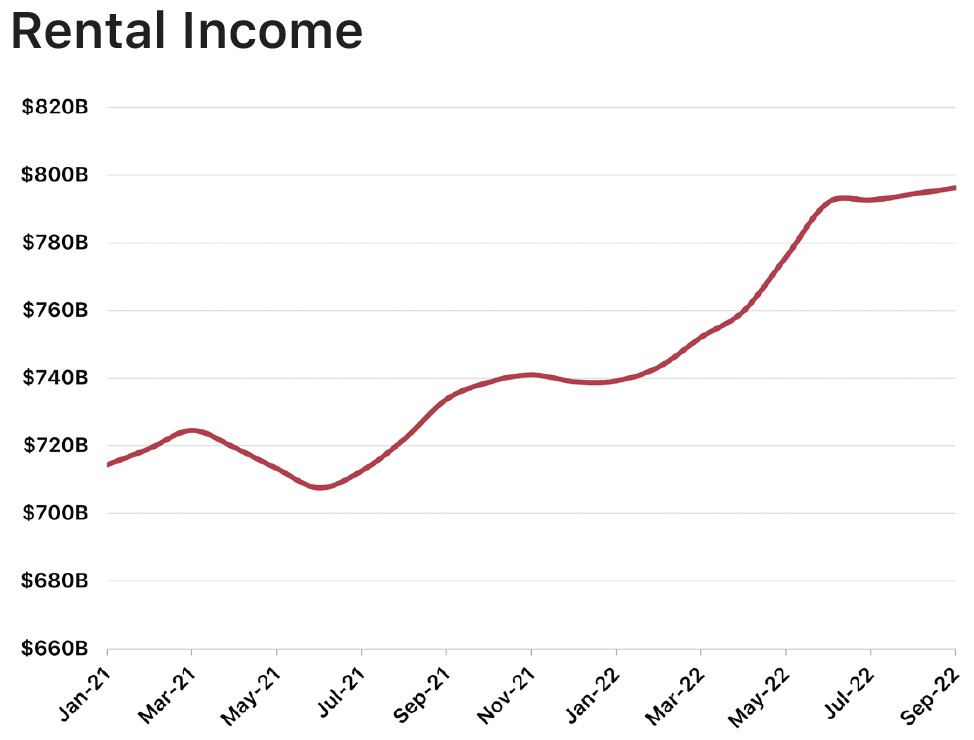
The deceleration of asking rents was reflected in a similar deceleration of rental income growth during Q3. Rental income increased by just +0.5% during Q3, as compared to +5.3% growth in Q2 and +1.8% growth in Q1. Despite the deceleration, annualized rental income growth in Q3 (+8.5%) remains well above 2021 levels (+3.4%). We expect total rental income to continue to flatten over the coming months, but strong demand should keep income levels from declining significantly.
Source: U.S. Census Bureau
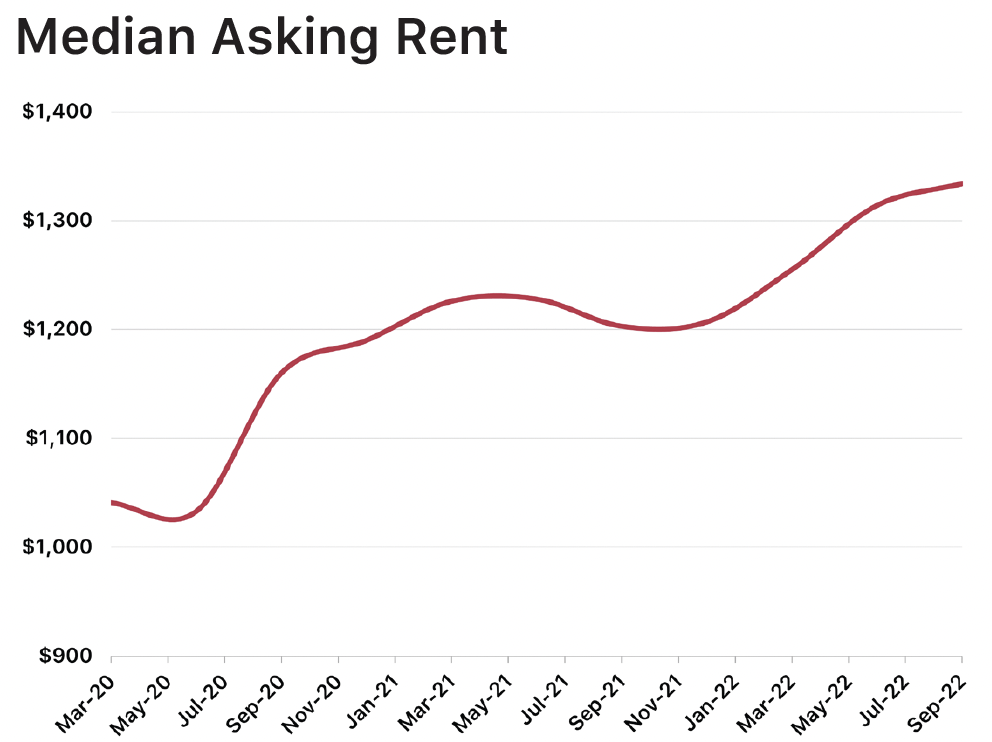
Historically low vacancy rates, an indicator of high demand, continue to drive monthly rent increases, although we did see a deceleration in rent growth during Q3. The median asking rent increased by +1.5% during Q3, compared to +4.7% in Q2 and +4.0% in Q1. Despite the notable uptick in rental unit starts during Q3, elongated construction times combined with strong demand are expected to keep the available supply of rental units low and prevent the median asking rent figure from experiencing a significant decline.
Conclusion
In the introduction, we used a “glass half empty/full” metaphor to describe the current economic situation. Given the fairly uneven data being reported across different sectors of the economy, there is evidence to support both optimistic and pessimistic views of what lies ahead. We are undoubtedly feeling the current pains of high inflation, clogged supply chains, and high prices while wondering the same two questions: How long will this last? And will it get worse before it gets better?
“Given how dramatically housing demand has fallen due to the rapid run-up in mortgage rates, we expect builders to begin offering more aggressive incentives to move their now-growing inventory of completed homes for sale.”
Mark Hamrick
Senior Economic Analyst, Bankrate
While there is no way to be sure, the St. Bourke team certainly leans towards a “glass half-full” mentality when considering the country’s economic outlook. The sharp contraction of the economy has certainly brought about a painful period of high inflation and consumer costs, but we remain optimistic that the actions taken by the Federal government combined with the natural, cyclical recalibration of the economy will lead to a general normalization of the housing market over the next 12-18 months. Some of the major indicators that support this view include:
Federal Government Intervention: The Federal Reserve Bank and Federal government have consistently shown that they are committed to curbing inflation, as evidenced by the passage of the Inflation Reduction Act in August and the 300-basis point increase (cumulative) to the Fed Funds Rate since March. Inflation has unready begin to drop, albeit more modestly than anticipated, and we expect consumer confidence and spending to improve as inflation continues to fall.
Underlying Demand: There is a common misconception that high home prices and mortgage rates have eroded demand for housing over the last six months. We believe that it is critical to point out that demand has not disappeared. There are not fewer people who want to buy a house now than there were 12 months ago; there are fewer people who can afford to buy a house now. Once interest rates return to more palatable levels, the housing market is going to enjoy a significant amount of pent-up demand from the Millennial (first-time and first-move up homebuyers) and Baby Boomer (retirement) generations - the two largest generations in American history. Additionally, the U.S. is facing a 4-5 million unit undersupply of housing on a national scale, ensuring that the housing supply will remain constrained for the foreseeable future.
Builder Appetite: St. Bourke works with a wide range of local and national homebuilders in markets spanning from Denver to Chicago to Miami, and the overwhelming sentiment we’ve gathered from our homebuilding partners is that they are still hungry (and in some cases, desperate) for residential land and homesites in prime suburban markets. While some builders like Pulte are playing it safe and walking away from thousands of acres of contracted land (and eating millions of dollars in forfieted deposits), far more builders are waiting in the wings to scoop these parcels up. The main difference now as compared to 12 months ago is that builders were previously willing to overpay for land in fringe markets because they were afraid of “missing out,” whereas now they have reverted to hunting down competitively-priced deals in markets with a track record of sustained demand.
For information about market research & reporting, including custom market reports, please contact Katie Fidler at katief@stbourke.com.

