National: 2Q2022
Housing Market Analysis
National Housing Market Analysis
The U.S. economy faced a number of headwinds during Q2 as it continued to recalibrate from the extended period of abnormal activity following the onset of the COVID-19 pandemic.
Concerns around inflation, rising costs, and increasing interest rates translated to a modest slowdown in consumer spending over the last 3 months; this slowdown, combined with a steep decrease in residential fixed investment and slowing business inventories, contributed to negative GDP growth during Q2. This is the second consecutive quarter of negative GDP growth (-1.6% in Q1, -0.9% in Q2), indicating that the U.S. has technically entered a recession period.
This recession does not have all the trademarks of a “typical” recession, however. Most critically, the jobs reports remain strong and indicate that more jobs are being added and subsequently filled by those previously out of work. Additionally, wage growth has accelerated in recent quarters (albeit due in part to rising consumer costs), and the relative financial position of the average American consumer (income, savings, debt) is much healthier than we’ve seen leading into previous recession periods.
“Affordability in the key concern in the housing market. Both home prices and mortgage rates have risen, shutting the door on many potential first-time buyers, who are having a difficult time.”
Jessica Lautz
Vice President of Demographics & Behavioral Insights, NAR
The housing market remains one of the economic segments most sensitive to the onset of and recovery from the onset of the COVID-19 pandemic. The housing market took off like a rocket in mid-2020, significantly outperforming most other sectors of the U.S. economy, due in large part to historically low interest rates and pent-up demand from the Millennial and Baby Boomer generations. Housing starts, completions, and sales approached (and in some cases surpassed) record-highs, and demand for housing remained well above normal levels through the end of 2021. Unfortunately, though, it appears as though the housing market is cooling as quickly as it heated up; the dip in Builder Confidence has resulted in a consistent decline in new construction activity since January, and high prices and increasing mortgage rates have eliminated a significant portion of potential homebuyers from the market.
Inflation: Inflation worsened during Q2, reaching its highest level in 40 years and fueling concerns around a potential recession on the horizon. Despite the three increases to the Fed Funds Rate during Q1-Q2, inflation rose to 9.06% by the end of June. Because most Americans are not seeing a comparable bump in their paychecks to offset the higher costs of everyday necessities like food, gas, and utilities (personal income growth over the last 12 months was just +5.7%), high inflation has already impacted consumer confidence and will most likely result in a short- to medium-term slowdown in consumer spending.
Mortgage Rates: As mentioned above, the Federal Reserve increased the Fed Funds Rate three times before the end of Q2 (150 combined basis points) and implemented another 75-basis point increase in late July while this report was being produced. The increase to the Fed Funds Rate has resulted in a sharp spike in mortgage rates during Q2; the 30-year mortgage rate increased to 5.7% by the end of June and is expected to end the year in the 5.5-6.5% range. This increase in mortgage rates is equivalent to adding tens of thousands of dollars to the base price of a home, further eroding affordability.
Affordability: Despite improving supply levels of both new and existing homes, high home prices continue to be a challenge in most housing markets across the country. The median new home price is up +7.4% from 12 months ago, and existing home prices are up +13.3% over the same period. A +7.0% increase in median asking rent over the last year means that renters are also facing a growing affordability crisis. While improving supply and normalizing demand should help to ease price growth, affordability is unlikely to bounce back in a significant way until construction costs and interest rates return to more palatable levels.
The data provided in this report has been interpreted and analyzed through the lens of residential land development and home construction. Understanding key metrics and their implications is essential to making informed business decisions and remaining flexible as an organization, especially during these unprecedented times.
Mortgage Rates
Source: Mortgage Bankers Association
Source: Mortgage Bankers Association
The 30-year mortgage rate climbed rapidly to 5.7% in Q2 due largely to the Federal Reserve’s three increases to the Fed Funds Rate in the first half of the year. The Federal Reserve raised the Fed Funds Rate an additional 75 basis point during their late July session, and additional rate increases totaling up to 100 basis points are expected before the end of the 2022. As such, 30-year mortgage rates are expected to climb further over the coming months, likely bouncing between 5.5% and 6.5% for the remainder of the year.
Inflation Rate
Source: Bureau of Labor Statistics
The inflation rate continued to climb during Q2, reaching the highest level seen in the U.S. since November 1981 by the end of June. The Q2 inflation rate of +9.06% is nearly double what it was 12 months prior (+5.39%) and is significantly above the 20-year average of +2.33%. Increases to the Fed Funds Rate, tightening monetary policy, and the pullback of government spending are working to slow consumer spending (lower consumer demand on the economy), decrease borrowing, and return inflation to more normal levels. Most economists predict that these efforts will bring the inflation rate back down towards +5.0% by the end of 2022 and +2.5% by the end of 2023.
Consumer Price Index
Source: Bureau of Labor Statistics
The Consumer Price Index has increased in line with overall inflation and ended Q2 at 295.33, a +2.7% increase from the end of Q1 and a nearly +9.0% increase from 12 months prior. The CPI increase is underpinned by significant price increases in food (+10.4% YoY) and energy (+41.6%), which includes +59.9%, +38.4%, and +13.7% increases in gasoline, natural gas, and electricity, respectively. These price increases are even tougher on consumers when you consider that inflation-adjusted wages are down -3.6% over the same period. Policymakers are hopeful that these inflationary pains will be short-lived and will ultimately work to restore price stability and ease supply chain issues over the coming months.
Consumer Sentiment
Builder Confidence
Source: National Association of Homebuilders, Wells Fargo
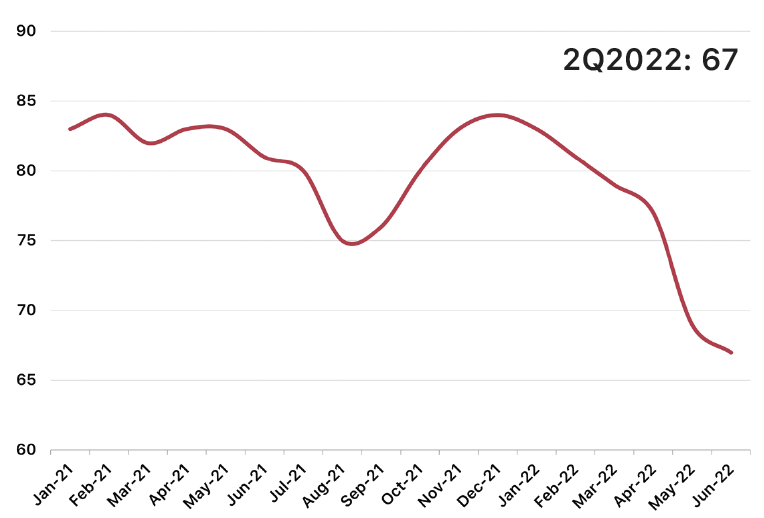
Builder Confidence continued its downward trajectory, decreasing from 79 at the end of Q1 to 67 at the end of Q2. Increasing mortgage rates, high land and construction costs, tight supply chains, and diminishing affordability are all contributing to the consistent decline in Builder Confidence. Declining demand should work to ease both pricing and material availability issues over the coming months, but we expect Builder Confidence to continue to decline in the short-term given that there is no quick-fix to these housing-related challenges on the horizon.
Source: University of Michigan Surveys of Consumers
Consumer Sentiment hit a record low in Q2, plummeting sharply to a level of 50.0 at the end of June. For context, Consumer Sentiment bottomed out at 71.8 in April 2020 (onset of the pandemic) and 55.3 in November 2008 (onset of the Great Recession). Consumer Sentiment is being heavily influenced by factors such as near-record high inflation, insufficient wage growth, and high interest rates, but will likely rebound once the anti-inflationary measures being taken by the Federal Reserve Bank and U.S. government begin to make a noticeable impact.
MF Housing Starts & Completions
SF Housing Starts & Completions
Source: U.S. Census Bureau
Annualized starts, which dropped below the 1M mark (982K) for the first time since June 2020, fell by -17.6% during Q2 and are down -15.6% from 12 months ago. Annualized completions fell by -5.3% to 996K during Q2 but remain +8.0% above their 2Q21 level. Despite consistent declines in recent months, both starts and completions remain above their long-term average levels. We expect this downward trajectory to continue in the short-term based on the evident pullback in demand.
Source: U.S. Census Bureau
Multifamily starts fared far better than their single-family counterpart during Q2, increasing by +9.9% from Q1 and by +15.2 from 2Q21. Completions fell slightly (-3.67%) from Q1 but are up +17.5% compared to their 2Q21 level. Skyrocketing home prices and mortgage rates have put additional pressure on the rental supply, and multifamily developers currently have a record number of units under construction to try to meet this demand.
Existing SF Home Sales & Price
New SF Home Sales & Price
Source: U.S. Census Bureau
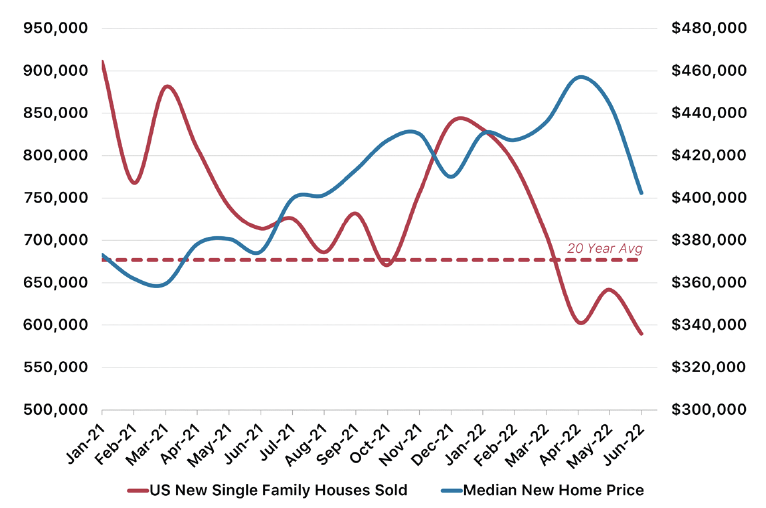
New home sales declined by -16.6% during Q2 and are down -17.4% from their 2Q21 level as unprecedented home price growth and rising interest rates have reduced the number of financially eligible buyers in the market. At just under 600K annualized new home sales, the current level is +12.9% above the long-term average. New home prices responded to faltering demand by declining by -7.7% during Q2, however prices are still up +7.4% compared to 12 months ago.
Source: National Association of Realtors
Due to a combination of rising home prices and increasing mortgage rates, existing single-family home sales have decreased by -15.5% since the beginning of the year and are down -12.8% over the last 12 months. Extremely low inventory has propped home prices up, however, and the median price for an existing home reached $423,300 at the end of Q2. This represents a +15.9% increase since January and a +13.3% increase from 2Q21. When adjusted for inflation, REAL home prices are up +7.8% from 2Q21.
Existing Home Supply
New Home Supply
Source: U.S. Census Bureau
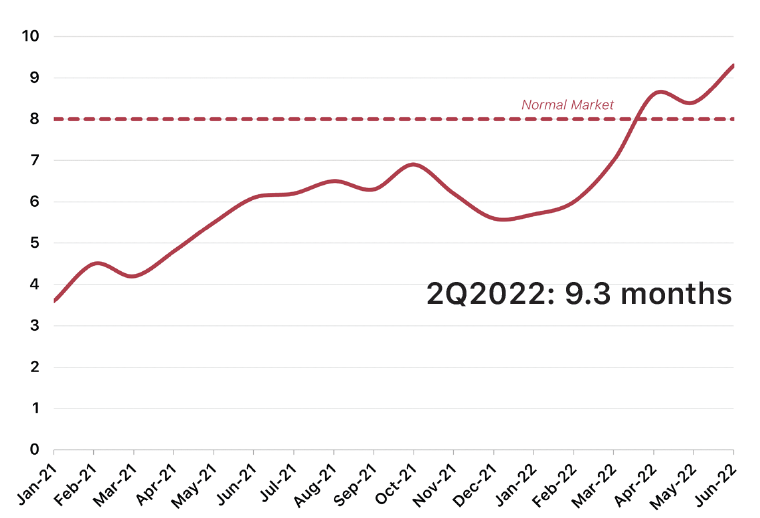
Diminishing demand has resulted in a (much needed) increase to the supply of new single-family homes. New home supply re-entered into “normal market” territory during Q2, improving from 7.0 months at the end of Q1 to 9.3 months at the end of June. Supply will continue to increase as more buyers pause their home purchase plans, however the pullback in starts and completions from builders will work to keep supply in balance with normal market levels in the short-term.
Source: National Association of Realtors
Declining home sales and increasing inventory have worked to improve the existing home supply, but the Q2 level of 2.9 months remains well below the 20-year average (5.6 months). Inventory increased by +35.5% during Q2 and is up +43.2% from the beginning of the year. In the short term, persistent demand from the Millennial and Baby Boomer generations will keep inventory low, and rising mortgage rates combined with high home prices will deter more homeowners from listing their current homes for sale.
Median Asking Rent
Rental Vacancy Rate
Source: U.S. Census Bureau
The rental vacancy rate continues to hover at record-low levels and ended Q2 at just 5.6%. The rapid increase in home prices and mortgage rates has eliminated many would-be first time homebuyers from the market and forced them to remain renters; this interference with the natural progression from renter to homeowner has tightened the supply of available rental units. As the record number of rental units in the construction pipeline deliver over the next 12-24 months, inventory and supply should better align with demand and vacancy rates will inch back up toward more normal levels.
Source: U.S. Census Bureau
Elevated demand for rental units has resulted in steep rent growth since the onset of the pandemic. The median asking rent continued its upward trajectory during Q2, increasing by +4.7% from the end of Q1 and +7.0% from 2Q21. For context, average annual rent growth in the 24 month period before the pandemic was +5.2% as compared to +13.1% average annual growth over the last 24 months. The median rent increase is even more impactful when you consider that rental units are are getting smaller, so many renters are paying the same amount (or more) for less space.
Conclusion
We knew it was coming.
We knew when the housing market exploded during the summer of 2020 that the upswing could not last forever. When the housing market stayed hot through 2021, setting pricing, construction, and supply level records along the way, we knew that it could not last forever. We knew that real estate was cyclical and that everntually the market would recalibrate and return to more normal levels.
That day has come.
While it’s easy to get caught up in the headlines spouting warnings of a housing bubble and evoking memories of the 2008 housing market crash, we need to remember a few key points:
The market desperately needs this. We are witnessing the market stablize in real time, and while the unknowns of the situation can be scary, factors like accelerating home price growth and shrinking inventories were actually doing more harm than good in the long-term. As the supply-demand balance is restored, we should see healthier new & existing home inventories and affordability move closer to pre-pandemic levels.
“After sellers had held a distinct advantage in the housing market, the scales have begun to tip more in buyers’ favor. This might be viewed as a journey towards a more normal market.”
Mark Hamrick - Senior Economic Analyst, Bankrate
Comparing our current situation to 2008 is an unfair, apples-to-oranges comparison, with really the only similarity being that demand for housing was very high during both time periods. While the main causes for the 2008 crash were sub-prime loans and builder overexposure, the issues we facing now revolve around diminishing affordability brought on by an extreme imbalance between supply and demand. Lender requirements for mortgages remain robust since the passage of the Dodd-Frank Act, and builders have exercised caution in regards to their lot inventory and housing production since coming out of the Great Recession more than a decade ago.
There are still a lot of reasons to be confident in the U.S. housing market moving forward. The massive Millennial and Baby Boomer generations will drive demand for housing, both rental and for-sale, across most price tiers for the foreseeable future; because the U.S. has been under-building homes for 10+ years, new home construction will have to remain elevated as compared to the long-term average. Despite being in a technical recession (two consecutive quarters of negative GDP growth), employment remains strong and the stock market continues to demonstrate relative resilience in the face of waning consumer confidence. And finally, the U.S. government is taking a hands-on approach to addressing inflation and will continue to implement policies to return inflation to more normal levels by the end of 2023 (2%).
For information about market research & reporting, including custom market reports, please contact Katie Fidler at katief@stbourke.com.


