National: 1Q2022
Housing Market Analysis
National Housing Market Analysis
The 1st quarter of 2022 is the first period since coming out of the depths of the COVID-recession in 2020 that the broader U.S. economy has felt a significant impact from the challenges we’ve faced (and solutions we’ve implemented) over the last 24 months.
National employment figures continued their recovery in Q1, and the unemployment rate stands at just 3.6% - only slightly above pre-pandemic levels. In fact, the U-6 unemployment rate, which measures both unemployed and under-employed persons, fell below pre-pandemic levels at the end of March. The employment sectors that took the hardest hit during the initial COVID-recession, namely Leisure & Hospitality, Education & Health Services, and Business & Professional Services, continue to lead the way in terms of employment gains and combined to add 267,000 jobs to the economy in March alone.
The United States’ GDP growth, however, went the opposite direction in Q1. Despite a strong finish to 2021 (+6.8% annual growth in Q4), advanced estimates indicate that the annualized GDP actually shrunk by -1.4% in Q1. Surging Omicron infections, rising prices, and inflation concerns took their toll on the stock market during Q1 as well. The S&P 500 declined by -5.0% in Q1 and is down -2.1% compared to its position 12 months ago.
“Recency bias may have many thinking that rates below 3 percent and house-buying power above $450,000 is normal, but it’s anything but normal from a historical perspective. The last two years were the exception, not the rule, and the housing market is adjusting to a not-so-new normal.”
Mark Fleming - Chief Economist, First American Title Insurance
From a housing perspective, we saw the national housing market continue to cool towards more normal levels following a period of record activity in the 12 months following the onset of the pandemic. Housing starts and new home completions remain near all-time high levels, however new home sales declined in each of the last 3 months which worked to improve the supply of both new and existing homes. The factors that had a significant impact on the housing market in Q1 include:
Growing Inflation Concerns: As an unfortunate (but not unexpected) consequence of pumping trillions of dollars into the economy in the form of pandemic-related stimulus and other government assistance payments to citizens and businesses, the rate of inflation as reached 8.54% - the highest level since 1981. This level of inflation becomes even more troubling when you consider that personal income has declined by nearly -12% over the last 12 months, and the Consumer Price Index has increased by +8.6% over that same period. Essentially, Americans are facing price increases without a corresponding increase in pay.
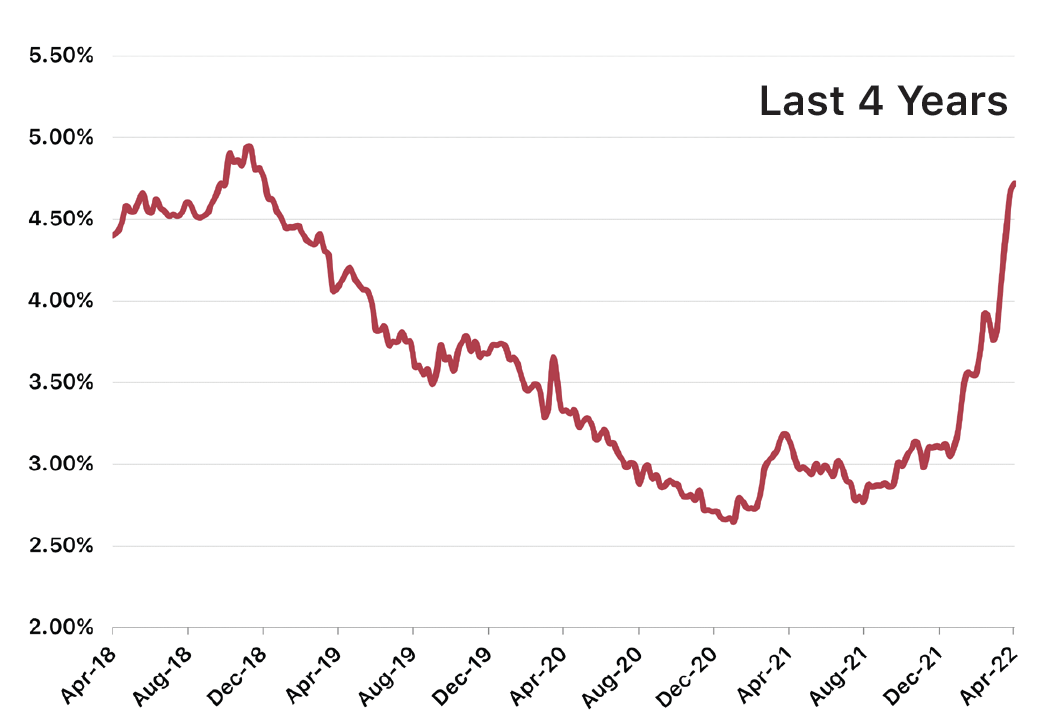
Increasing Mortgage Rates: In 2021, the Federal Reserve announced that it would raise the Fed Funds Rate six times during 2022 in an effort to combat rising inflation. Mortgage rates, which had hovered near record low levels for the better part of two years, began increasing dramatically in early January and continued their climb through Q1. 30-year mortgage rates ultimately increased by +50.2% during Q1 and stood at 4.67% at the end of March. Increasing mortgage rates add hundreds of dollars to buyers’ monthly payments, exacerbating growing concerns around housing affordability.
Accelerating Home Price Growth: Persistent supply chain issues, labor shortages, critically low inventory, and rising land prices continue to apply upward pressure on the price of both new and existing homes. New and existing home prices increased by +6.5% and +5.7%, respectively, during Q1 and have increased by +15.2% and +21.4% over the last 12 months. When you compare annualized home price growth with annualized personal income growth (-11.6%), it’s easy to understand why affordability is declining at such an extreme rate.
The data provided in this report has been interpreted and analyzed through the lens of residential land development and home construction. Understanding key metrics and their implications is essential to making informed decisions and remaining flexible as a business, especially during these unprecedented times.
Mortgage Rates
Source: Mortgage Bankers Association
Source: Mortgage Bankers Association
The Federal Reserve Bank increased interest rates by 25 basis points in mid-March, marking the first increase in rates since 2018. 30-year mortgage rates, which started the year just above 3.1%, increased steadily through January and February and jumped above 4.0% almost immediately following the rate hike announcement. 30-year mortgage rates had eclipsed 4.6% at the end of Q1 and are expected to increase further has the Federal Reserve Bank plans for 6 additional rate increases before the end of the year.
Builder Confidence
Source: National Association of Homebuilders, Wells Fargo
Persistent concerns around supply chain disruptions, price increases, labor shortages, and depleted lot inventory continue to impact Builder Confidence. Despite solid buyer traffic, Builder Confidence dipped below 80 in Q1 to its lowest level since the onset of the pandemic in 2020. In addition to increasing construction costs (+20% YoY) and interrupted supply chains, builders are now combatting increasing concerns around housing affordability and rising interest rates. Sustained demand will continue to keep Builder Confidence in positive territory (above 50 is considered positive), however the headwinds detailed above will likely keep Builder Confidence below the record-high levels established in 2020.
Single-Family Housing Starts
Source: U.S. Census Bureau
Annualized single-family housing starts were relatively unchanged during Q1, declining by just -0.25% from the end of 2021 and by -4.3% over the last 12 months. Despite the lack of consistency from one month to the next over the last 12-18 months, single-family starts remain well above the 20-year average and will remain at a comparatively high level given the sustained demand. Note that single-family starts would be consistently higher if homebuilders were less constrained by low inventory, pricing, materials availability, and skilled labor issues.
New Single-Family Home Sales
Single-Family Home Completions
Source: U.S. Census Bureau
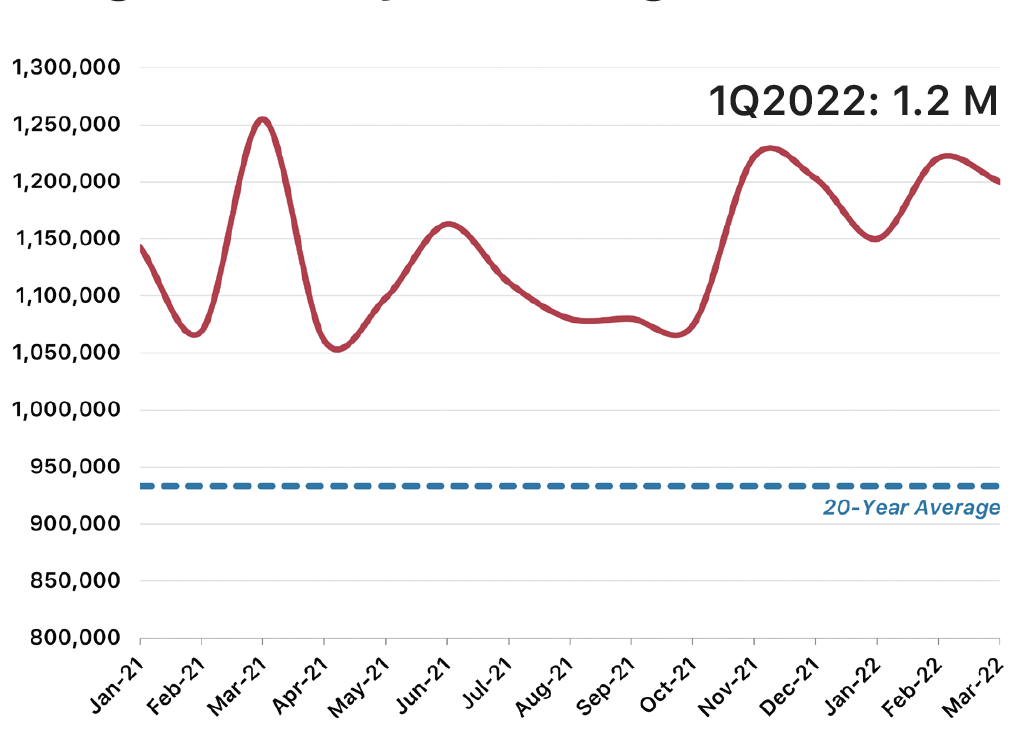
After ending 2021 with positive momentum, annualized single-family housing completions dropped sharply in January but rebounded strongly in February through March. Over the last 12 months, the U.S. has completed just 1.0 million new homes; while breaking into seven figures is a certainly a move in the right direction, the current level is well below the estimated 1.5 million - 1.6 million new home completions that the U.S. needs each year just to keep pace with population growth and demand.
Source: U.S. Census Bureau
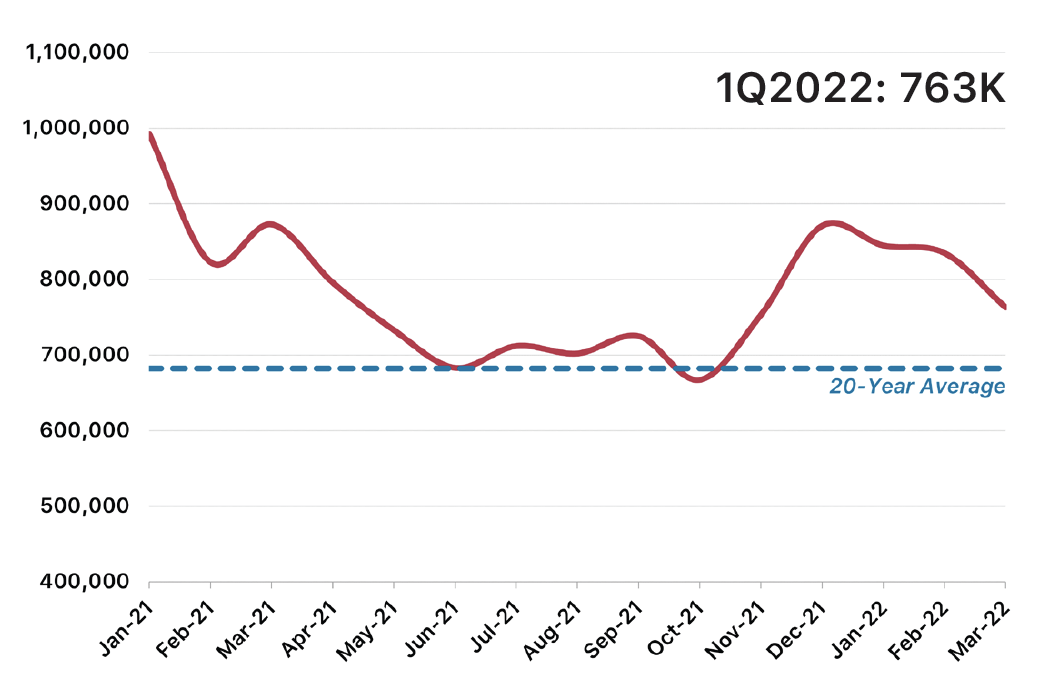
Annualized new single-family home sales declined modestly but steadily throughout Q1 due to a combination of rising prices, increasing interest rates, low supply, and (intentionally) limited housing starts and sales by homebuilders. With this gradual return to seasonality, we expect new home sales to rebound in the Spring and Summer months although it is very likely that the aforementioned factors will continue to keep new home sales in check over the coming months.
Median Sale Price: Existing Homes
Median Sale Price: New Homes
Source: U.S. Census Bureau, National Association of Homebuilders
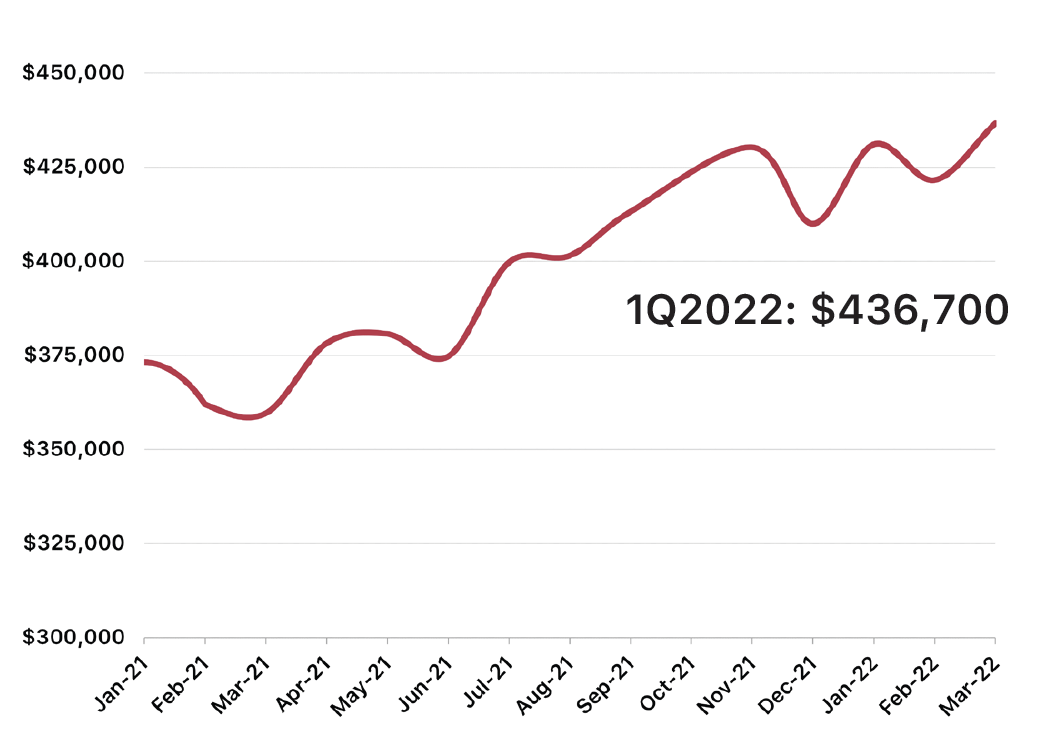
New home sales prices continued their upward trajectory through Q1. Median home prices increased by +6.5% during Q1 and have increased by +21.4% over the last 12 months. When you consider that inflation has risen to 8.5%, the highest level since December 1981, and personal income decreased by -11.6% over that same 12-month period, it’s easy to understand why affordability has become a top concern for buyers, builders, and community leaders across the country.
Source: National Association of Realtors
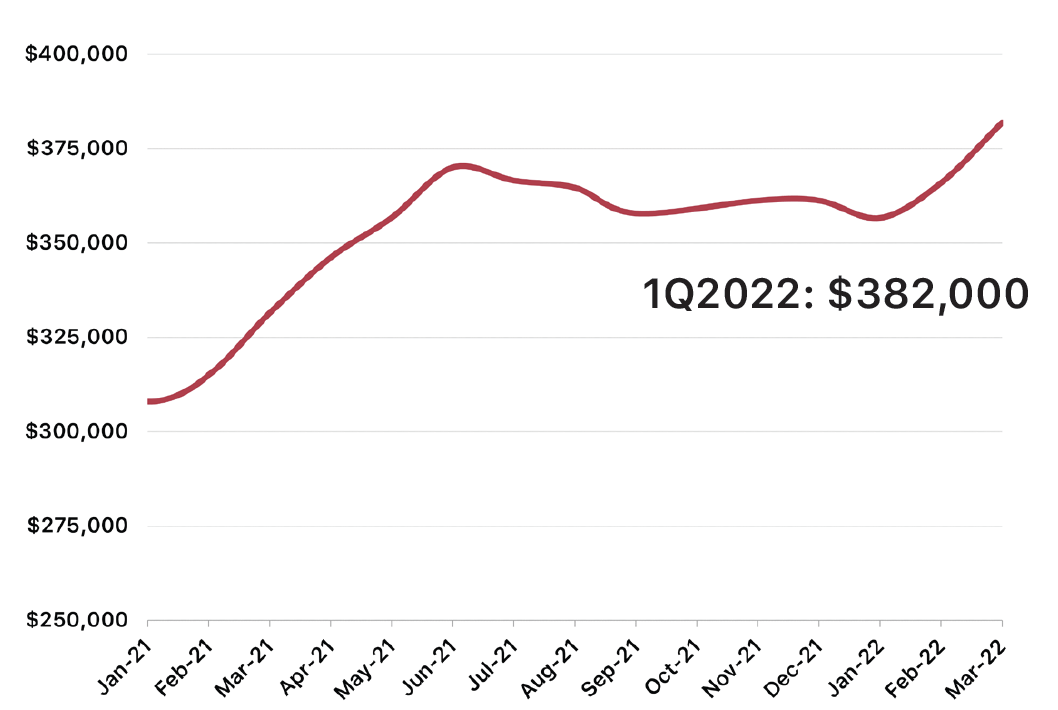
Median existing home sale prices increased in line with new home sale prices during Q1, growing by +5.7% since the beginning of the year and by +15.2% over the last 12 months. Existing home sale prices remain at record high due largely to the extremely low inventory level, which remains significantly below the long-term average (more on the following page). We expect price growth acceleration to improve gradually over the coming months as demand responds to record-high prices.
Existing Home Supply (Months)
New Home Supply (Months)
Source: U.S. Census Bureau
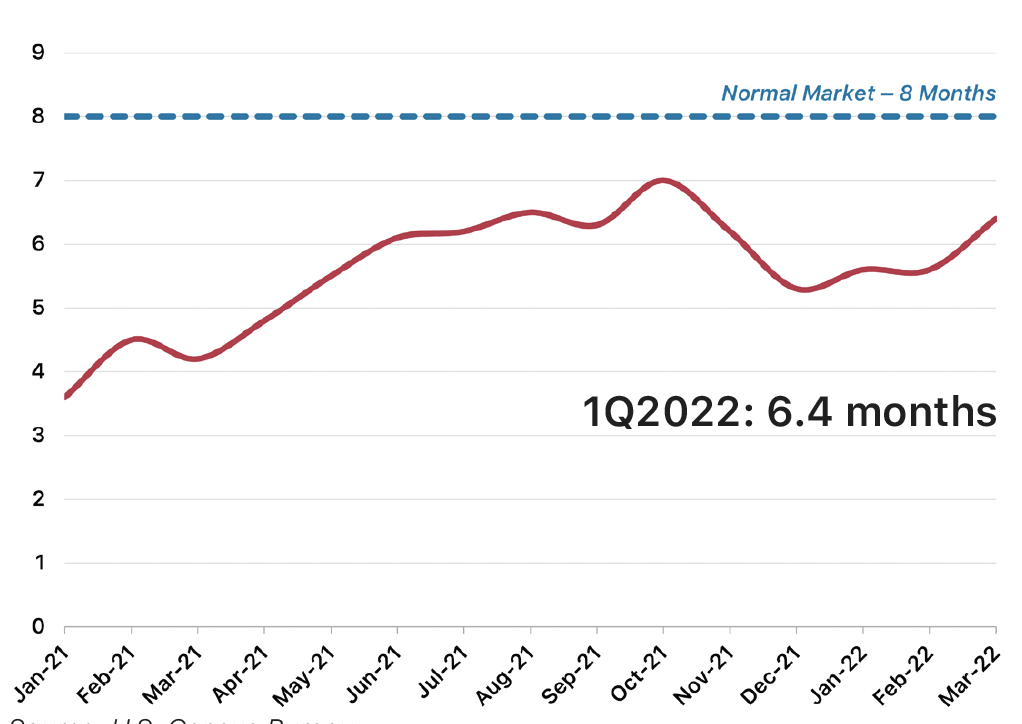
New home supply increased modestly through Q1 and currently stands at 6.4 months, approximately -20% below “normal” market levels. It should be noted that this increase in supply is not necessarily an indication that homebuilders added additional spec homes to their inventories; inventory levels of available new homes remained relatively steady in Q1, so this increase in supply is a result of a pullback in demand/sales rather than an actual increase in inventory.
Source: National Association of Realtors
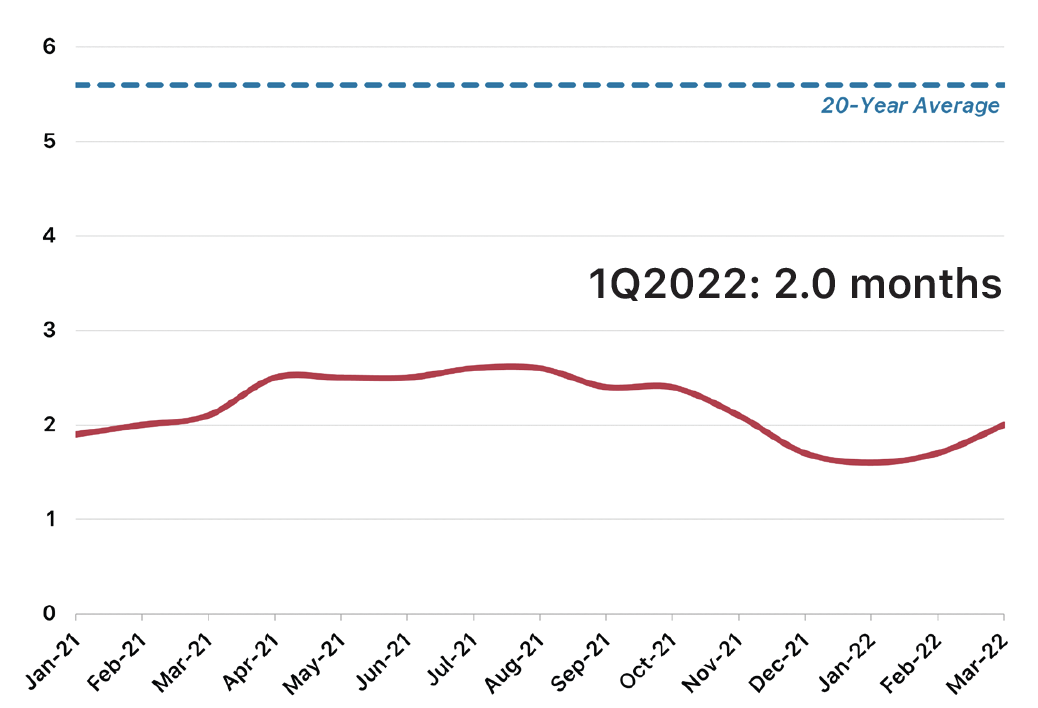
Existing home supply improved slightly in Q1, breaking the 2.0-month threshold for the first time since November. Supply remains well below the 20-year average (6 months), and while we do expect supply levels to improve in the coming months as prices and interest rates continue to negatively impact demand, it is very likely that they will remain below the historical average for the remainder of the year.
Conclusion
The U.S. economy continues to sail through uncharted waters as we navigate the complex economic and housing challenges that have arisen from the COVID pandemic and ensuing recession. In many ways, the pandemic exacerbated existing issues (like the underbuilding of new homes for 10+ years) and created a set of brand-new issues (like the highest inflation rate
in 40 years). And while policy makers, federal agencies, and community leaders are working diligently to “right the ship,” it’s abundantly clear that there is no quick fix. Some of these issues will just require time for the economy to recalibrate and stabalize following such an abnormal period, but others will require large-scale shifts in our approach to housing.
Based on the trajectory established in Q1, we believe that both new and existing home prices will continue to climb through the rest of 2022, however we expect that monthly and annualized growth will begin to return to more normal levels as we move through the year. The combination of rising home prices and higher mortgage rates will force an increasing number of potential buyers out of the market, which will work to improve the supply levels and restore balance between supply & demand. Relieving the current supply/demand imbalance should help price growth return to levels more in line with the historical average and improve housing affordability.
Given noticeable declines in some key housing metrics like Builder Confidence, home sales, and housing affordability, some have speculated that we are currently in a housing bubble similar to that which we faced in the mid-2000s - a bubble that is rapidly heading towards a burst. We don’t believe this to be the case, however. In fact, we would argue that our current housing situation is night-and-day different than what we faced in the mid-2000s. While high demand and increasing home prices are characterstic of both time periods, that’s where the similarities begin to wain. We feel reasonably confident that the housing market, while certainly dealing with its own challenges, will not be a contributing factor should the U.S. indeed fall into a recession in the coming months.
“The housing market is in a much stronger position compared with a decade ago. Accompanied by more rigorous lending standards, the household debt-to-income ratio is at a four-decade low and household equity near a three-decade high.”
Odeta Kushi - Deputy Chief Economist, First American Title Insurance
For information about market research & reporting, including custom market reports, please contact Katie Fidler at katief@stbourke.com.


